


一、多合一显示
1、subplot方法:设置行、列和起始点
plt.subplot(2,1,1) # 分成两行一列,起始点为1
2、代码
# -*- coding: utf-8 -*-
"""
Created on Sun Sep 24 15:02:51 2017

@author: ryoyun
"""

# subplot 多合一显示
import matplotlib.pyplot as plt

plt.figure()

plt.subplot(2,1,1)      # 分成两行一列,起始点为1
plt.plot([0,1],[0,1])   # 设置xy轴范围

plt.subplot(2,3,4)      # 分成两行三列,起始点位4
plt.plot([0,1],[0,2])

plt.subplot(2,3,5)
plt.plot([0,1],[0,3])

plt.subplot(2,3,6)
plt.plot([0,1],[0,4])

plt.show()
3、效果

二、分格显示
1、代码
# -*- coding: utf-8 -*-
"""
Created on Sun Sep 24 15:11:01 2017
@author: ryoyun
"""
# 分格显示
import matplotlib.pyplot as plt
import matplotlib.gridspec as gridspec
# method 1: subplot2grid
############################
#plt.figure()
#ax1 = plt.subplot2grid((3,3),(0,0),colspan = 3,rowspan = 1)
#ax1.plot([1,2],[1,2])
#ax1.set_title('ax1_title')
#plt.figure()
#ax2 = plt.subplot2grid((3,3),(1,0),colspan = 2)
#ax3 = plt.subplot2grid((3,3),(1,2),rowspan = 2)
#ax4 = plt.subplot2grid((3,3),(2,0))
#ax5 = plt.subplot2grid((3,3),(2,1))
# method 2: gridspec
###########################
#plt.figure()
#gs = gridspec.GridSpec(3,3)
#ax1 = plt.subplot(gs[0,:])
#ax2 = plt.subplot(gs[1,:2])
#ax3 = plt.subplot(gs[1:,2])
#ax4 = plt.subplot(gs[-1,0])
#ax5 = plt.subplot(gs[-1,-2])
# method 3: easy to define structure
###########################
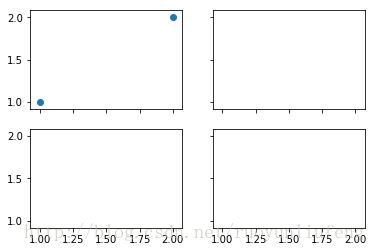
f,((ax11,ax12),(ax21,ax22)) = plt.subplots(2,2,sharex=True,sharey=True)
ax11.scatter([1,2],[1,2])
plt.tick_layout()
plt.show()
2、效果
三、图中图
1、每个图的位置设定很重要
left,bottom,width,height = 0.1,0.1,0.8,0.8
ax1 = fig.add_axes([left,bottom,width,height])# 设置位置
2、代码
# -*- coding: utf-8 -*-
"""
Created on Sun Sep 24 15:32:13 2017

@author: ryoyun
"""

# 图中图
import matplotlib.pyplot as plt
import numpy as np

fig = plt.figure()
x = [1,2,3,4,5,6,7]
y = [1,3,4,2,5,8,6]

left,bottom,width,height = 0.1,0.1,1.5,1.5
ax1 = fig.add_axes([left,bottom,width,height])# 设置位置
ax1.plot(x,y,'r')
ax1.set_xlabel('x')
ax1.set_ylabel('y')
ax1.set_title('title')


left,bottom,width,height = 0.2,0.6,0.25,0.25
ax2 = fig.add_axes([left,bottom,width,height])
ax2.plot(y,x,'b')
ax2.set_xlabel('x')
ax2.set_ylabel('y')
ax2.set_title('title inside 1')

plt.axes([.6,0.2,0.25,0.25])
plt.plot(y[::-1],x,'g')
plt.xlabel('x')
plt.ylabel('y')
plt.title('title inside 2')


plt.show()
3、效果

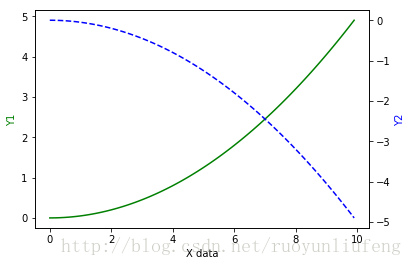
四、次坐标轴(两个Y轴)
1、画几个散点一点都不难
ax2 = ax1.twinx() # 做镜像处理,ax2是ax1的镜像
2、代码
# -*- coding: utf-8 -*-
"""
Created on Sun Sep 24 15:44:29 2017

@author: ryoyun
"""

# 次坐标轴
import matplotlib.pyplot as plt
import numpy as np

x = np.arange(0,10,0.1)
y1= 0.05*x**2
y2= -1*y1

fig,ax1 = plt.subplots()
ax2 = ax1.twinx()           # 做镜像处理
ax1.plot(x,y1,'g-')
ax2.plot(x,y2,'b--')

ax1.set_xlabel('X data')    #设置x轴标题
ax1.set_ylabel('Y1',color = 'g')   #设置Y1轴标题
ax2.set_ylabel('Y2',color = 'b')   #设置Y2轴标题

plt.show()
3、效果
五、Animation动画
1、代码
# -*- coding: utf-8 -*-
"""
Created on Sun Sep 24 15:51:25 2017

@author: ryoyun
"""

# animation 动画
from matplotlib import animation
import matplotlib.pyplot as plt
import numpy as np

fig, ax = plt.subplots()

x = np.arange(0,2*np.pi,0.01)
line, = ax.plot(x,np.sin(x))

def animate(i):
    line.set_ydata(np.sin(x+i/100))
    return line,

def init():
    line.set_ydata(np.sin(x))
    return line,

ani = animation.FuncAnimation(fig =fig,func=animate,frames= 100,init_func=init,
                              interval=20,blit=False,)


plt.show()
2、效果

参考:莫烦python https://morvanzhou.github.io/tutorials/


 683
683


 被折叠的 条评论
为什么被折叠?
被折叠的 条评论
为什么被折叠?
 到【灌水乐园】发言


