


1. 三角函数曲线(1):
h0=figure('toolbar','none',...
    'position',[198 56 350 300],...
    'name','实例01');
x=-pi:0.05:pi;
y=sin(x);
plot(x,y);
xlabel('自变量X');
ylabel('函数值Y');
title('SIN( )函数曲线');
grid on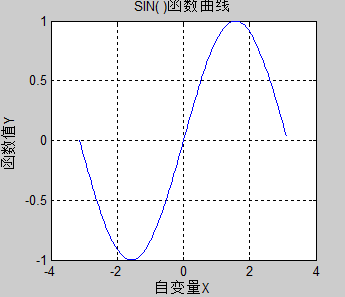
2. 三角函数曲线(2)
h0=figure('toolbar','none',...
    'position',[200 150 450 350],...
    'name','实例02');
x=-pi:0.05:pi;
y=sin(x)+cos(x);
plot(x,y,'-*r','linewidth',1);
grid on
xlabel('自变量X');
ylabel('函数值Y');
title('三角函数');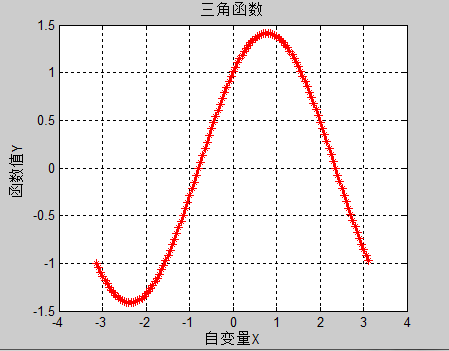
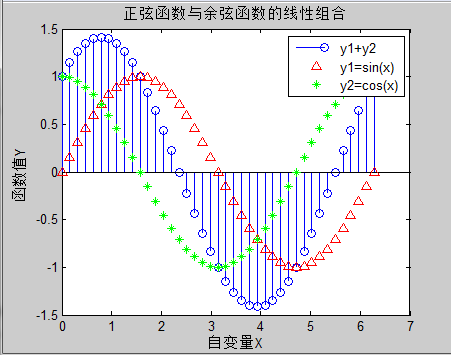
3. 图形的叠加
h0=figure('toolbar','none',...
    'position',[200 150 450 350],...
    'name','实例03');
x=-pi:0.05:pi;
y1=sin(x);
y2=cos(x);
plot(x,y1,...
    '-*r',...
    x,y2,...
    '--og');
grid on
xlabel('自变量X');
ylabel('函数值Y');
title('三角函数');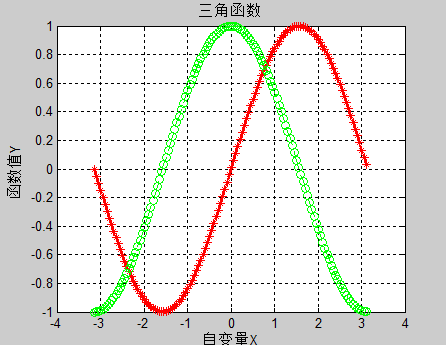
4. 单个轴窗口显示多个图形:
h0=figure('toolbar','none',...
    'position',[200 150 450 250],...
    'name','实例05');
t=0:pi/10:2*pi;
[x,y]=meshgrid(t);
subplot(2,2,1)
plot(sin(t),cos(t))
axis equal

subplot(2,2,2)
z=sin(x)-cos(y);
plot(t,z)
axis([0 2*pi -2 2])

subplot(2,2,3)
h=sin(x)+cos(y);
plot(t,h)
axis([0 2*pi -2 2])

subplot(2,2,4)
g=(sin(x).^2)-(cos(y).^2);
plot(t,g)
axis([0 2*pi -1 1])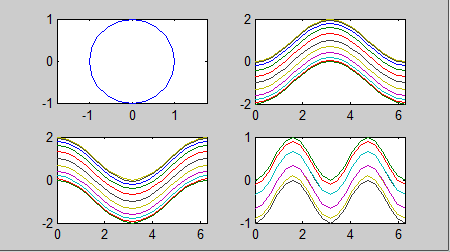
5. 图形标注:
h0=figure('toolbar','none',...
    'position',[200 150 450 400],...
    'name','实例06');
t=0:pi/10:2*pi;
h=plot(t,sin(t));
xlabel('t=0到2\pi','fontsize',16);
ylabel('sin(t)','fontsize',16);
title('\it{从 0to2\pi 的正弦曲线}','fontsize',16)
x=get(h,'xdata');
y=get(h,'ydata');
imin=find(min(y)==y);
imax=find(max(y)==y);
text(x(imin),y(imin),...
    ['\leftarrow最小值=',num2str(y(imin))],...
    'fontsize',16)
text(x(imax),y(imax),...
    ['\leftarrow最大值=',num2str(y(imax))],...
    'fontsize',16)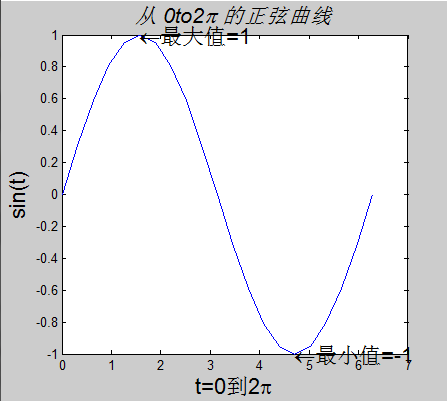
6. 条形图形:
h0=figure('toolbar','none',...
    'position',[200 150 450 400],...
    'name','实例06');
t=0:pi/10:2*pi;
h=plot(t,sin(t));
xlabel('t=0到2\pi','fontsize',16);
ylabel('sin(t)','fontsize',16);
title('\it{从 0to2\pi 的正弦曲线}','fontsize',16)
x=get(h,'xdata');
y=get(h,'ydata');
imin=find(min(y)==y);
imax=find(max(y)==y);
text(x(imin),y(imin),...
    ['\leftarrow最小值=',num2str(y(imin))],...
    'fontsize',16)
text(x(imax),y(imax),...
    ['\leftarrow最大值=',num2str(y(imax))],...
    'fontsize',16)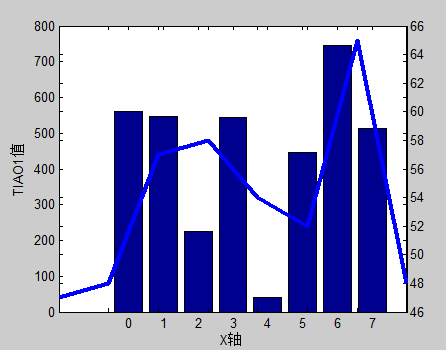
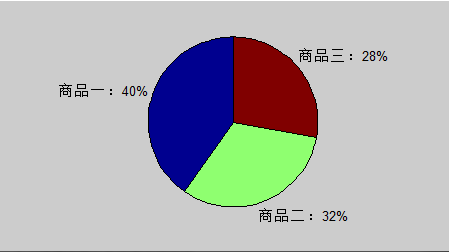
7. 饼图的绘制:
h0=figure('toolbar','none',...
    'position',[200 150 450 250],...
    'name','实例09');
t=[54 21 35;
    68 54 35;
    45 25 12;
    48 68 45;
    68 54 69];
x=sum(t);
h=pie(x);
textobjs=findobj(h,'type','text');
str1=get(textobjs,{'string'});
val1=get(textobjs,{'extent'});
oldext=cat(1,val1{:});
names={'商品一:';'商品二:';'商品三:'};
str2=strcat(names,str1);
set(textobjs,{'string'},str2)
val2=get(textobjs,{'extent'});
newext=cat(1,val2{:});
offset=sign(oldext(:,1)).*(newext(:,3)-oldext(:,3))/2;
pos=get(textobjs,{'position'});
textpos=cat(1,pos{:});
textpos(:,1)=textpos(:,1)+offset;
set(textobjs,{'position'},num2cell(textpos,[3,2]))
8. 阶梯图:
h0=figure('toolbar','none',...
    'position',[200 150 450 400],...
    'name','实例10');
a=0.01;
b=0.5;
t=0:10;
f=exp(-a*t).*sin(b*t);
stairs(t,f)
hold on
plot(t,f,':*')
hold off
glabel='函数e^{-(\alpha*t)}sin\beta*t的阶梯图';
gtext(glabel,'fontsize',16)
xlabel('t=0:10','fontsize',16)
axis([0 10 -1.2 1.2])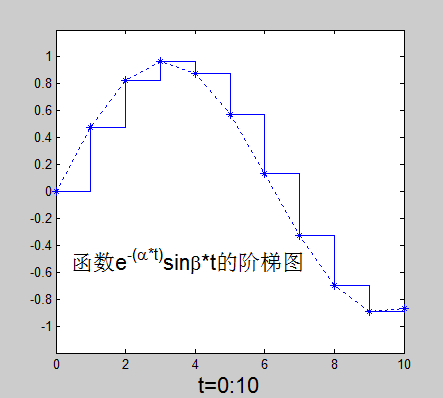
9. 枝干图:
10. 罗盘图:
h0=figure('toolbar','none',...
    'position',[200 150 450 250],...
    'name','实例12');
winddirection=[54 24 65 84
    256 12 235 62
    125 324 34 254];
windpower=[2 5 5 3
    6 8 12 7
    6 14 10 8];
rdirection=winddirection*pi/180;
[x,y]=pol2cart(rdirection,windpower);
compass(x,y);
desc={'风向和风力',
    '北京气象台',
    '10月1日0:00到',
    '10月1日12:00'};
gtext(desc)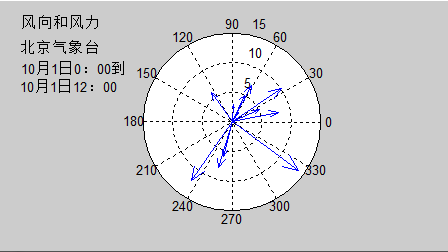
11. 轮构图:
h0=figure('toolbar','none',...
    'position',[200 150 450 250],...
    'name','实例13');
[th,r]=meshgrid((0:10:360)*pi/180,0:0.05:1);
[x,y]=pol2cart(th,r);
z=x+i*y;
f=(z.^4-1).^(0.25);
contour(x,y,abs(f),20)
axis equal
xlabel('实部','fontsize',16);
ylabel('虚部','fontsize',16);
h=polar([0 2*pi],[0 1]);
delete(h)
hold on
contour(x,y,abs(f),20)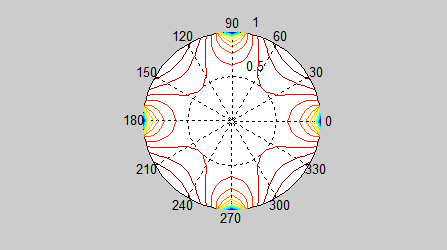
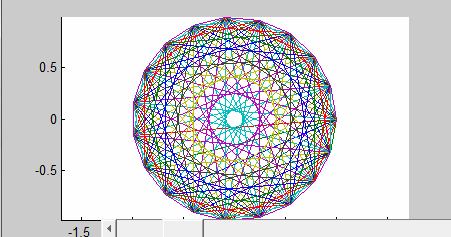
12. 变换的傅立叶函数曲线:
h0=figure('toolbar','none',...
    'position',[200 150 450 250],...
    'name','实例15');
axis equal
m=moviein(20,gcf);
set(gca,'nextplot','replacechildren')
h=uicontrol('style','slider','position',...
    [100 10 500 20],'min',1,'max',20)
for j=1:20
    plot(fft(eye(j+16)))
    set(h,'value',j)
    m(:,j)=getframe(gcf);
end
clf;
axes('position',[0 0 1 1]);
movie(m,30)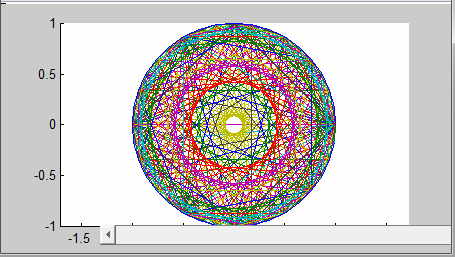
13. 劳伦兹非线形方程的无序活动:
h0=figure('toolbar','none',...
    'position',[200 150 450 250],...
    'name','实例15');
axis equal
m=moviein(20,gcf);
set(gca,'nextplot','replacechildren')
h=uicontrol('style','slider','position',...
    [100 10 500 20],'min',1,'max',20)
for j=1:20
    plot(fft(eye(j+16)))
    set(h,'value',j)
    m(:,j)=getframe(gcf);
end
clf;
axes('position',[0 0 1 1]);
movie(m,30)
14. 填充图
h0=figure('toolbar','none',...
    'position',[200 150 450 250],...
    'name','实例17');
t=(1:2:15)*pi/8;
x=sin(t);
y=cos(t);
fill(x,y,'r')
axis square off
text(0,0,'STOP',...
    'color',[1 1 1],...
    'fontsize',50,...
    'horizontalalignment','center')


 6067
6067


 被折叠的 条评论
为什么被折叠?
被折叠的 条评论
为什么被折叠?
 到【灌水乐园】发言


