转载请标明出处(请勿转载删除底部微博、微信等信息):
http://blog.csdn.net/y1258429182/article/details/51379367
本文出自:杨哲丶的博客
ExpandListView大家估计也用的不少了,一般有需要展开的需求的时候,大家不约而同的都想到了它
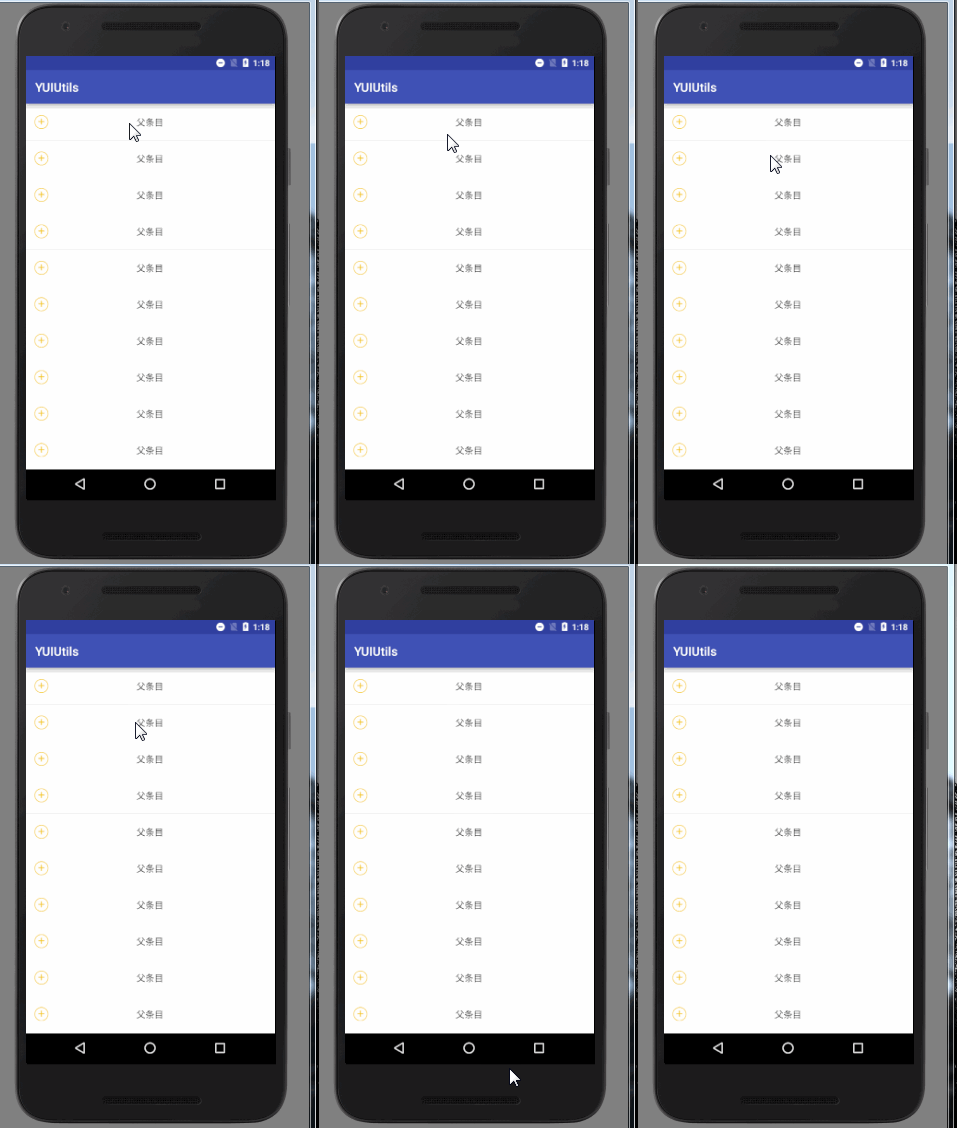
然后以前自己留过记录的一般都会找找以前自己的代码,没有记录习惯的就会百度、谷歌,这里吐槽一下,好几次发现用百度搜索一个知识点的时候,一页都是一样的答案,能不能抄袭出一点水平,咱改一个字也可以呀!!原封不动的抄袭,还不带参考链接!!废话不多说了,先上效果图吧!!
原生的ExpandListView的问题
- 父条目展开的时候,图标的变化!!原生的是丑陋的箭头,而且位置我们也不好控制!!
- 展开的子条目如果也需要我给出的效果图一样的效果….我们不能很方便的定义子条目的视图
灵光一现的解决办法
核心思想: 把陌生的领域转化为我们熟悉的领域里解决
通俗的说法就是,把我们不好控制的父条目和子条目,换成自己的可以控制的View,我们就可以像平时一样操控UI,来实现我们的需求!!
父条目图标的变换问题
- 首先要将ExpandListView的默认的箭头图标取消
    <ExpandableListView
      android:id="@+id/expand_lv_main"
      android:layout_width="match_parent"
      android:layout_height="match_parent"
      android:divider="@null"
      android:dividerHeight="0.5dp"
      android:groupIndicator="@null"
      android:scrollbars="none"
/>- 为了实现我们父条目展开和未展开的图标变换,可以通过isExpanded的属性来判断。
 /**
  * 自定义组
  */
public View getGroupView(final int groupPosition, boolean isExpanded, View convertView, ViewGroup parent) {
         ....省略代码
         if (!isExpanded) {
            mIvItem.setImageResource(R.drawable.group_plus);
            mLineShow.setVisibility(View.INVISIBLE);
            RelativeLayout.LayoutParams layoutParams = (RelativeLayout.LayoutParams) diliver_group.getLayoutParams();
            layoutParams.leftMargin = DimenUtils.dp2px(mContext, 0);
            diliver_group.setLayoutParams(layoutParams);

        } else {
            mIvItem.setImageResource(R.drawable.group_sub);
            mLineShow.setVisibility(View.VISIBLE);
            RelativeLayout.LayoutParams layoutParams = (RelativeLayout.LayoutParams) diliver_group.getLayoutParams();
            layoutParams.leftMargin = DimenUtils.dp2px(mContext, 46);
            diliver_group.setLayoutParams(layoutParams);
        }

         ....省略代码
        return view;
    }
子条目的处理
这也是我要分享这个巧妙写法的最重要的一环,就是将子条目返回为的数量写死为1,然后返回ListView,就是将不熟悉的问题转换为我们熟悉的问题上,这就很好处理了吧!!重要代码如下
  /**
    * 返回值必须为1,否则会重复数据
    */
    public int getChildrenCount(int groupPosition) {
        return 1;
    }
然后子条目返回为ListView
/**
 * 自定义子条目
 */
public View getChildView(int groupPosition, int childPosition,
    // ...数据的添加
    convertView = View.inflate(parentContext, R.layout.follow_view, null);
    lv_follow = (FollowListView) convertView.findViewById(R.id.lv_follow);
    mMAdapter = new MyAdapter(data);
    lv_follow.setAdapter(mMAdapter);// 设置菜单Adapter
    return convertView;
}
因为展开会出现错误,需要将ListView进行处理一下,重写一下测量的方法
public class FollowListView extends ListView {
    public FollowListView(android.content.Context context,
                          android.util.AttributeSet attrs) {
        super(context, attrs);

    }

    /**
     * 设置不滚动
     */
    public void onMeasure(int widthMeasureSpec, int heightMeasureSpec) {
        int expandSpec = MeasureSpec.makeMeasureSpec(Integer.MAX_VALUE >> 2,
                MeasureSpec.AT_MOST);
        super.onMeasure(widthMeasureSpec, expandSpec);

    }
}
然后大工告成!!!
源码地址
- 欢迎Follow和Star,如果对你有帮助的话
https://github.com/StudyLifeTime/YUIUtils
关注博主是一种态度,评论博主是一种欣赏!!
欢迎关注我的微博:
http://weibo.com/u/5345060833
关注微信公众号:YangZheShare
(欢迎关注,最新最实用的技术干货分享)


 3566
3566

 被折叠的 条评论
为什么被折叠?


