


 本文详细介绍了如何使用Python的matplotlib库绘制矩形、多边形、圆形、椭圆形、弧线、线段以及多条连续线段,包括各自的绘图代码和坐标轴设置。
今天我们使用matplotlib库绘制数学图形。
13.1绘制矩形
13.1.1图像呈现
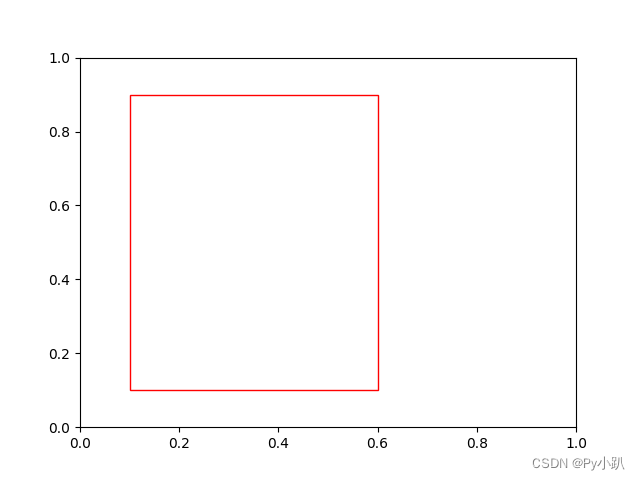
13.1.2绘图代码
import matplotlib.pyplot as plt
import matplotlib.patches as patches

fig, ax = plt.subplots()

# 创建一个矩形,参数为(x, y, width, height)
rect = patches.Rectangle((0.1, 0.1), 0.5, 0.8, linewidth=1, edgecolor='r', facecolor='none')

# 将矩形添加到子图中
ax.add_patch(rect)

plt.xlim(0, 1)
plt.ylim(0, 1)
plt.show()
13.2绘制多边形
13.2.1图像呈现
13.2.2绘图代码
import matplotlib.pyplot as plt
import matplotlib.patches as patches
import numpy as np

# 创建一个新的图形和坐标轴
fig, ax = plt.subplots()

# 定义多边形的顶点坐标
vertices = np.array([[0.1, 0.1], [0.4, 0.8], [0.8, 0.1], [0.6, 0.5]])

# 创建一个多边形对象
polygon = patches.Polygon(vertices, closed=True, edgecolor='black', facecolor='none')

# 将多边形添加到坐标轴上
ax.add_patch(polygon)

# 设置坐标轴的限制以适应多边形
ax.set_xlim(min(vertices[:, 0]) - 0.1, max(vertices[:, 0]) + 0.1)
ax.set_ylim(min(vertices[:, 1]) - 0.1, max(vertices[:, 1]) + 0.1)

# 显示图形
plt.show()
13.3根据圆心和半径绘制图形
13.3.1图像呈现
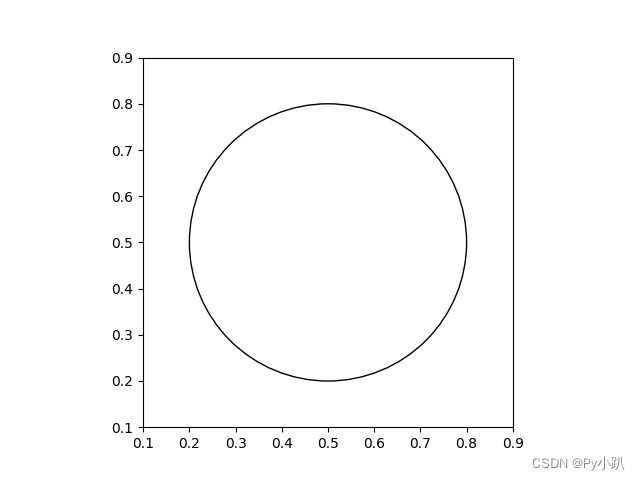
13.3.2绘图代码
import matplotlib.pyplot as plt
import matplotlib.patches as patches

# 定义圆心和半径
center = (0.5, 0.5)  # 圆心坐标 (x, y)
radius = 0.3         # 半径

# 创建一个新的图形和坐标轴
fig, ax = plt.subplots()

# 创建一个圆形对象
circle = patches.Circle(center, radius, edgecolor='black', facecolor='none')

# 将圆形添加到坐标轴上
ax.add_patch(circle)

# 设置坐标轴的限制以适应圆形
ax.set_xlim(center[0] - radius - 0.1, center[0] + radius + 0.1)
ax.set_ylim(center[1] - radius - 0.1, center[1] + radius + 0.1)

# 设置坐标轴为等比例,这样圆形不会变形
ax.set_aspect('equal', 'box')

# 显示图形
plt.show()
13.4绘制椭圆形
13.4.1图像呈现
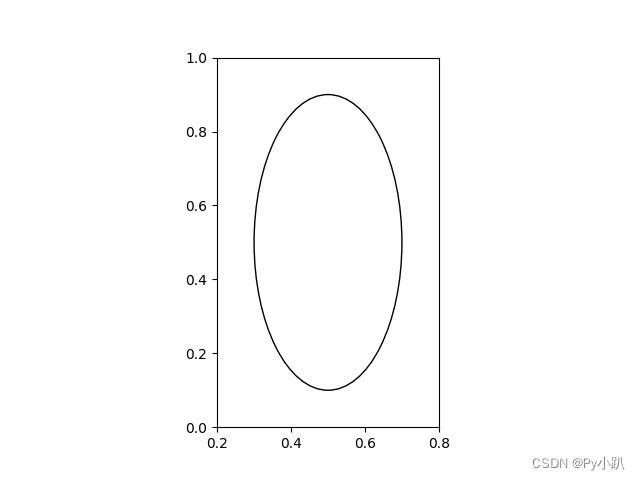
13.4.2绘图代码
import matplotlib.pyplot as plt
import matplotlib.patches as patches

# 定义椭圆的中心、宽度和高度
center = (0.5, 0.5)  # 椭圆中心坐标 (x, y)
width = 0.4         # 椭圆的宽度
height = 0.8        # 椭圆的高度

# 创建一个新的图形和坐标轴
fig, ax = plt.subplots()

# 创建一个椭圆形对象
ellipse = patches.Ellipse(center, width, height, edgecolor='black', facecolor='none')

# 将椭圆形添加到坐标轴上
ax.add_patch(ellipse)

# 设置坐标轴的限制以适应椭圆形
ax.set_xlim(center[0] - width / 2 - 0.1, center[0] + width / 2 + 0.1)
ax.set_ylim(center[1] - height / 2 - 0.1, center[1] + height / 2 + 0.1)

# 设置坐标轴为等比例,以确保椭圆形不被拉伸
ax.set_aspect('equal', 'box')

# 显示图形
plt.show()
13.5 绘制弧线
13.5.1图像呈现
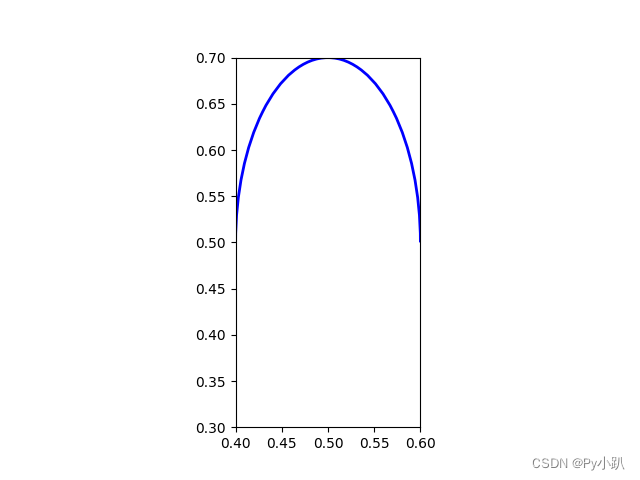
13.5.2绘图代码
import matplotlib.pyplot as plt
import matplotlib.patches as patches

# 创建一个新的图形和坐标轴
fig, ax = plt.subplots()

# 定义弧线的参数
center = (0.5, 0.5)  # 圆心坐标 (x, y)
width = 0.2  # 弧线的宽度
height = 0.4  # 弧线的高度
angle = 0  # 起始角度(相对于x轴的逆时针旋转角度)
theta = 180  # 跨越的角度(以度为单位)

# 创建一个弧线对象
arc = patches.Arc(center, width, height, angle=angle, theta1=0, theta2=theta, lw=2, color='blue', fill=False)

# 将弧线添加到坐标轴上
ax.add_patch(arc)

# 设置坐标轴的限制以适应弧线
ax.set_xlim(center[0] - width / 2, center[0] + width / 2)
ax.set_ylim(center[1] - height / 2, center[1] + height / 2)

# 设置坐标轴为等比例,以确保弧线不被拉伸
ax.set_aspect('equal', adjustable='box')

# 显示图形
plt.show()
13.6绘制线段
13.6.1图像呈现
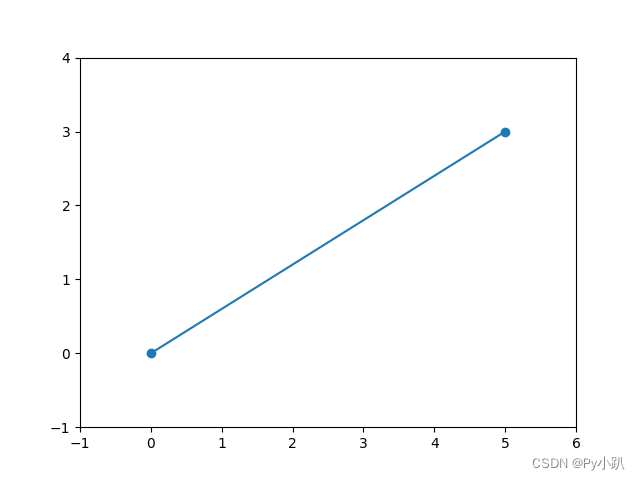
13.6.2绘图代码
import matplotlib.pyplot as plt
import numpy as np

# 定义线段的起点和终点
start_point = (0, 0)
end_point = (5, 3)

# 使用matplotlib的plot函数来绘制线段
x = np.array([start_point[0], end_point[0]])
y = np.array([start_point[1], end_point[1]])

plt.plot(x, y, marker='o')  # marker='o' 用于在起点和终点处添加圆圈标记

# 设置坐标轴的范围,以确保线段完全可见
plt.xlim(min(x) - 1, max(x) + 1)
plt.ylim(min(y) - 1, max(y) + 1)

# 显示图形
plt.show()
13.7绘制多条连续的线段
13.7.1图像呈现
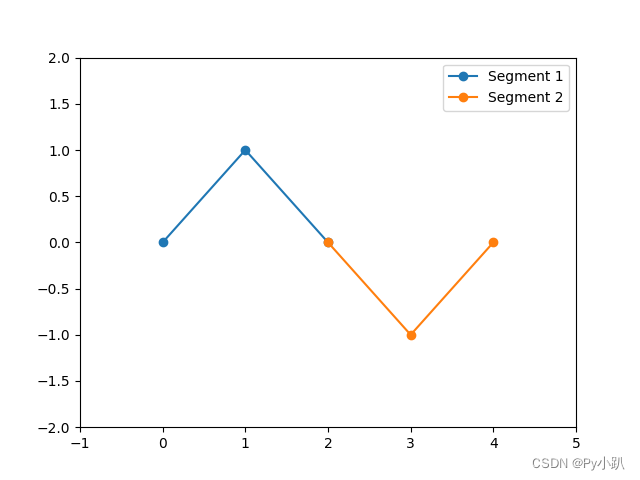
13.7.2绘图代码
import matplotlib.pyplot as plt

# 定义两组点的坐标,每组点将连接成一条线段
points1 = [(0, 0), (1, 1), (2, 0)]
points2 = [(2, 0), (3, -1), (4, 0)]

# 提取x和y坐标
x1, y1 = zip(*points1)
x2, y2 = zip(*points2)

# 使用plot函数绘制两条不连续的线段
plt.plot(x1, y1, marker='o', label='Segment 1')
plt.plot(x2, y2, marker='o', label='Segment 2')

# 添加图例
plt.legend()

# 设置坐标轴的范围,以确保线段完全可见
plt.xlim(min(min(x1, x2)) - 1, max(max(x1, x2)) + 1)
plt.ylim(min(min(y1, y2)) - 1, max(max(y1, y2)) + 1)

# 显示图形
plt.show()


 950
950

 被折叠的 条评论
为什么被折叠?
被折叠的 条评论
为什么被折叠?
 到【灌水乐园】发言


