


matplotlib可以将整个画布规划成等分布局的m乘n的矩阵区域,并按照先行后列的方式对每个区域进行编号,之后在选中的某个或某些区域中绘制单个或多个子图。
绘制单个子图
使用pyplot的subplot()函数可以在规划好的某个区域中绘制单个子图,subplot()函数的语法格式下。
rowspan:表示向下跨越的行数,默认为1。
colspan:表示向右跨越的列数,默认为1。
fig:表示放置子图的画布,默认为当前画布。
plt.tight_layout()函数:调整各区域紧凑布局。
#插入模块
import numpy as np
import matplotlib.pyplot as plt
#设置中文
plt.rcParams['font.sans-serif'] = ["SimHei"]#插入数据
x = [x for x in range(1, 13)]
y1 = [20, 28, 23, 16, 29, 36, 39, 33, 31, 19, 21, 25]
y2 = [17, 22, 39, 26, 35, 23, 25, 27, 29, 38, 28, 20]
labels = ['1 月', '2 月', '3 月', '4 月', '5 月', '6 月', '7月', '8 月', '9 月', '10 月', '11 月', '12 月']
#绘制第一个子图
ax1 = plt.subplot2grid((2,4),(0,1),colspan=2)
ax1.plot(x, y1, 'm--o', lw=2, ms=5, label='产品A')
ax1.plot(x, y2, 'g--o', lw=2, ms=5, label='产品B')
ax1.set_title("产品A 与产品B的销售额", fontsize=11)
ax1.set_ylim(10, 45)
ax1.set_ylabel('销售额(亿元)')
ax1.set_xlabel('月份')
for xy1 in zip(x, y1):
    ax1.annotate("%s" % xy1[1], xy=xy1, xytext=(-5, 5), textcoords='offset points')
for xy2 in zip(x, y2):
    ax1.annotate("%s" % xy2[1], xy=xy2, xytext=(-5, 5), textcoords='offset points')
ax1.legend()
#绘制第二个子图
ax2 = plt.subplot2grid( (2,4), (1,0) )
ax2.pie(y1, radius=2, wedgeprops={'width':0.5}, labels=labels, autopct='%3.1f%%', pctdistance=0.75)
ax2.set_title('产品A的销售额 ')
#绘制第三个子图
ax3 = plt.subplot2grid((2,4),(1,3))
ax3.pie(y2, radius=2, wedgeprops={'width':0.5}, labels=labels,autopct='%3.1f%%', pctdistance=0.75)
ax3.set_title('产品B的销售额 ')
# 调整子图之间的距离
plt.tight_layout()#图像展示
plt.show()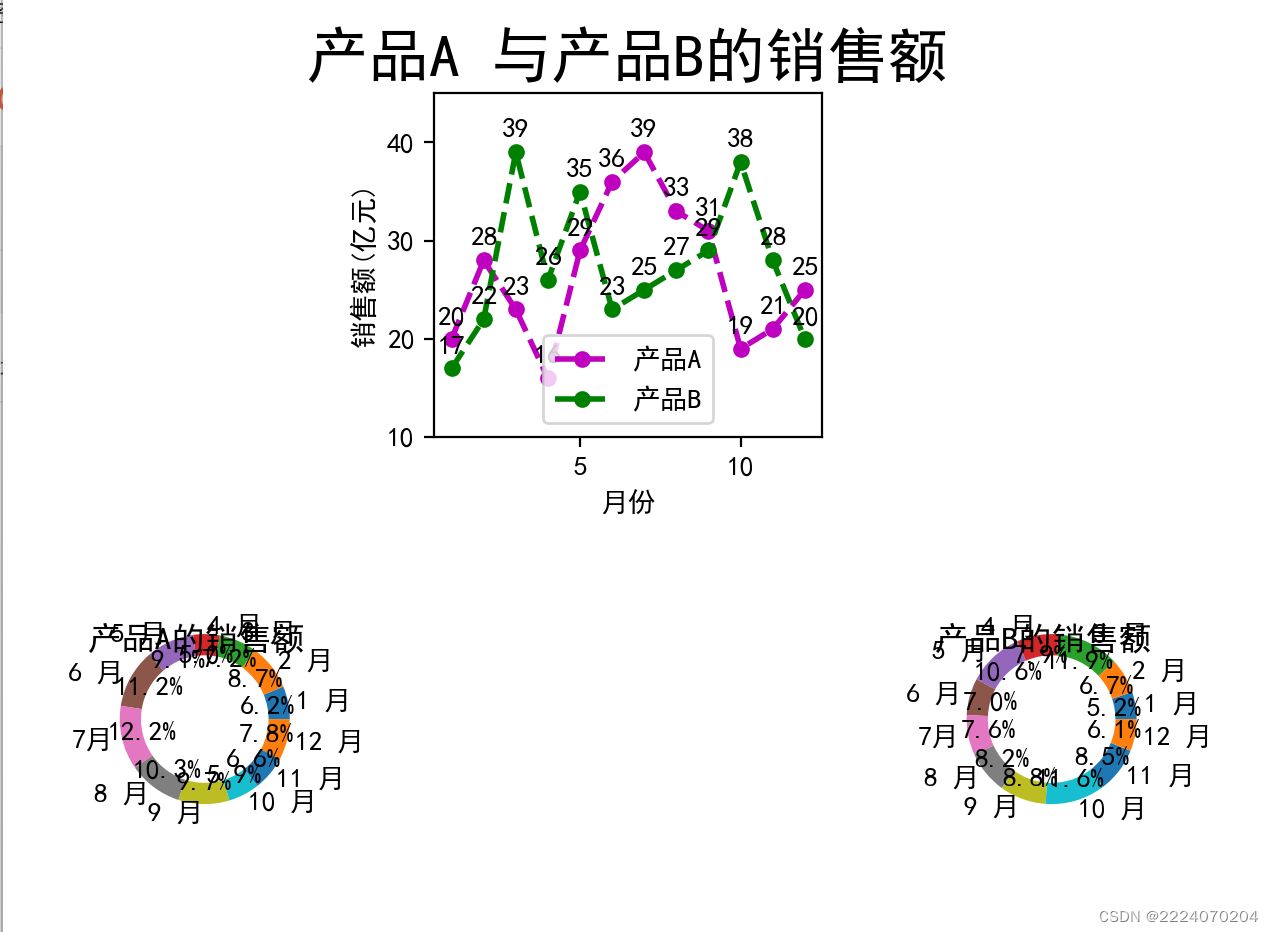


 1992
1992


 被折叠的 条评论
为什么被折叠?
被折叠的 条评论
为什么被折叠?
 到【灌水乐园】发言


