


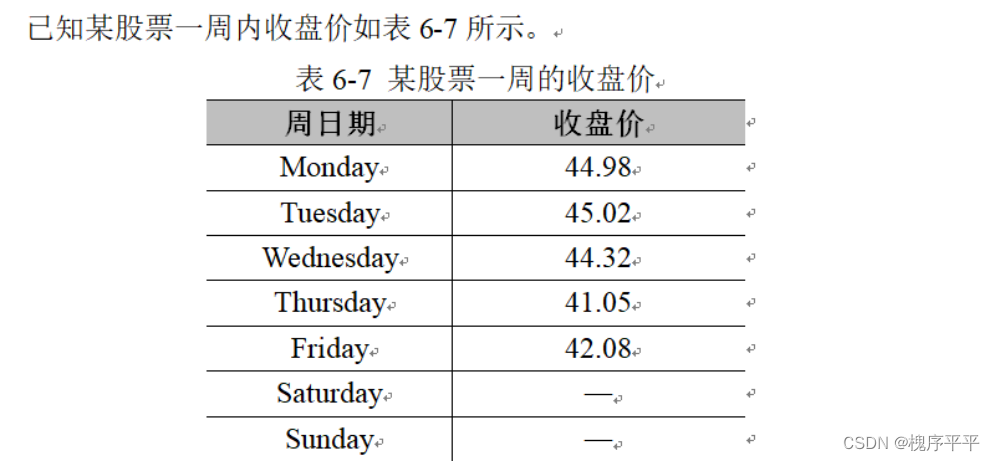
一周内的收盘数据如下:
图表要求:
(1)在距画布顶部0.2、左侧0.2的位置上添加一个宽度为0.5、高度为0.5的绘图区域
(2)x轴的刻度标签为周日期
(3)刻度线的样式调整:方向朝内、宽度为2、长度为8
(4)隐蔽坐标轴的上轴脊、右轴脊
#导入模块
%matplotlib notebook
import numpy as np
import matplotlib.pyplot as plt
# 0.设置中文黑体
plt.rcParams["font.sans-serif"] = ["SimHei"]
plt.rcParams["axes.unicode_minus"] = False
# 1.准备数据
x_data = np.arange(1,8,1)
y_data = [44.98, 45.02, 44.32, 41.05, 42.08, 42.08, 42.08] # 周末休市
# 2.创建画布和坐标系
ax = plt.axes((0.2,0.2, 0.5,0.5))
# 3.绘图
ax.plot(x_data,y_data,'mo-',markersize='10')
# 4.定制刻度
labels=['41','42','43','44','45']
labels1=['周一','周二','周三','周四','周五','周六','周日']
ax.set_xticks(x_data)
ax.set_xticklabels(labels1)
ax.set_yticks([41,42,43,44,45])
ax.set_yticklabels(labels)
# 5.设置轴标签
ax.tick_params(axis='both',bottom=True,top=False,left=True,right=False,
direction='in',length=8,width=2)
ax.tick_params(axis='x',labelrotation=45)
ax.set_xlabel('周日期',labelpad=20,fontdict={'fontsize':'13'})
ax.set_ylabel('收盘价(¥)',fontdict={'rotation':360,'fontsize':'12'},labelpad=30)
#'vertical'竖直'horizontal'水平
# 6.隐藏上轴脊和右轴脊
ax.spines['top'].set_color('none')
ax.spines['right'].set_color('none')
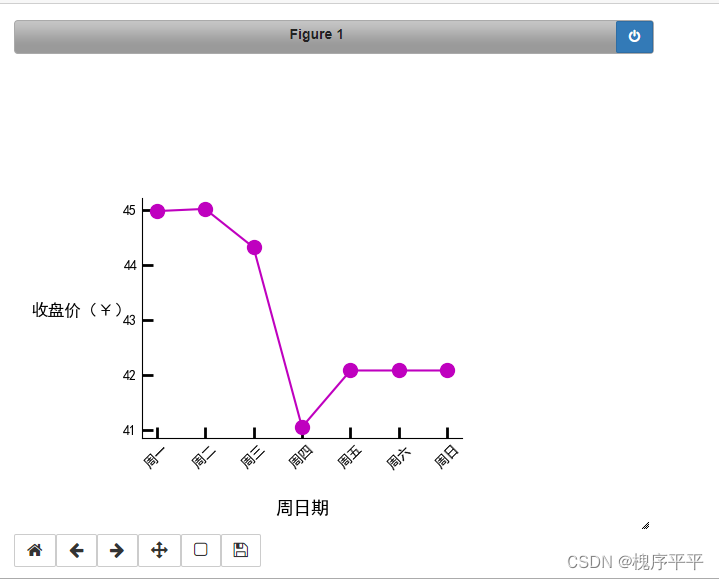
# 7.展示图表
plt.show()运行程序,效果如图:
代码解析:
# 2.创建画布和坐标系
ax = plt.axes((0.2,0.2, 0.5,0.5))
axes()函数
axes(arg=None, projection=None, polar=False, aspect, frame_on, **kwargs)
参数含义:
arg=None(使用subplot(111)添加的与画布同等大小的Axes对象)
4-tuple--(left,bottom,width,height)
left,bottom表示坐标轴左侧和底部的边缘到画布的相对距离----确定坐标轴的位置
width,height表示坐标轴的宽度和高度----确定坐标轴的相对大小
projection 表示坐标轴类型(None, aitoff, hammer, lambert, mollweide, polar, rectilinear)
polar 表示是否使用极坐标 == projection=‘polar’
aspect 表示坐标轴缩放的比例(auto,equal,num)
frame_on 表示是否绘制每个坐标轴的轴脊
# 5.设置轴标签
ax.tick_params(axis='both',bottom=True,top=False,left=True,right=False,
               direction='in',length=8,width=2)

ax.tick_params(axis='x',labelrotation=45)
tick_params()函数
tick_params(axis='both', **kwargs)
参数含义:
axis 表示选择操作的轴('x', 'y', 'both'(默认))
reset 若为True 表示在处理其他参数之前均使用参数的默认值
which 表示刻度的类型('major'(默认), 'minor', 'both')
direction 表示刻度线的方向('in', 'out', 'inout')
length 表示刻度线的长度
width 表示刻度线的宽度
color 表示刻度线的颜色
pad 表示刻度线与刻度标签的距离
labelsize 表示刻度标签的字体大小
labelcolor 表示刻度标签的颜色
bottom,top,left,right 表示是否显示下方、上方、左侧、右侧的刻度线(布尔值)
labelbottom,labeltop,labelleft,labelright 表示是否显示下方,上方,左侧,右侧的刻度线(布尔值)
labelrotation 表示刻度标签旋转的角度
# 6.隐藏上轴脊和右轴脊
ax.spines['top'].set_color('none')
ax.spines['right'].set_color('none')
matplotlib 可以只隐藏坐标轴的部分轴脊,只需要访问 spines 属性获取相应的轴脊,之后调用set_color() 方法将轴脊的颜色设为 none 即可


 438
438

 被折叠的 条评论
为什么被折叠?
被折叠的 条评论
为什么被折叠?
 到【灌水乐园】发言


