


卫星图像地面目标识别数据集(Satellite Image Ground Target Recognition Dataset, SIGTRD)
摘要
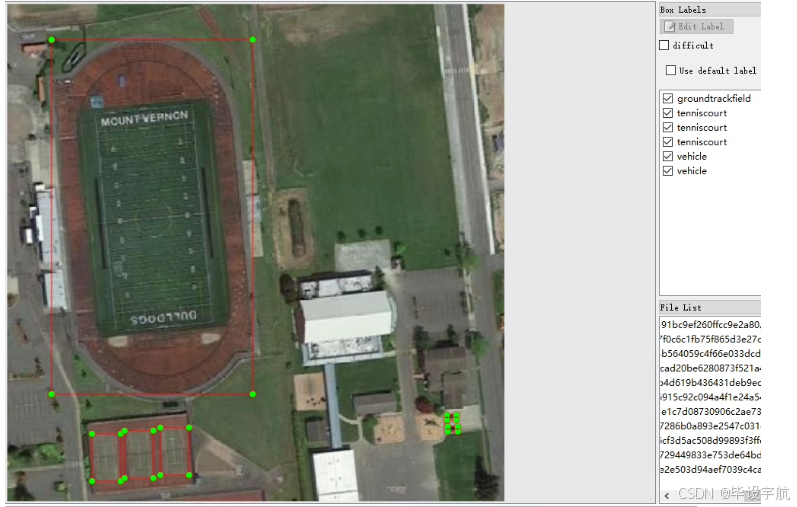
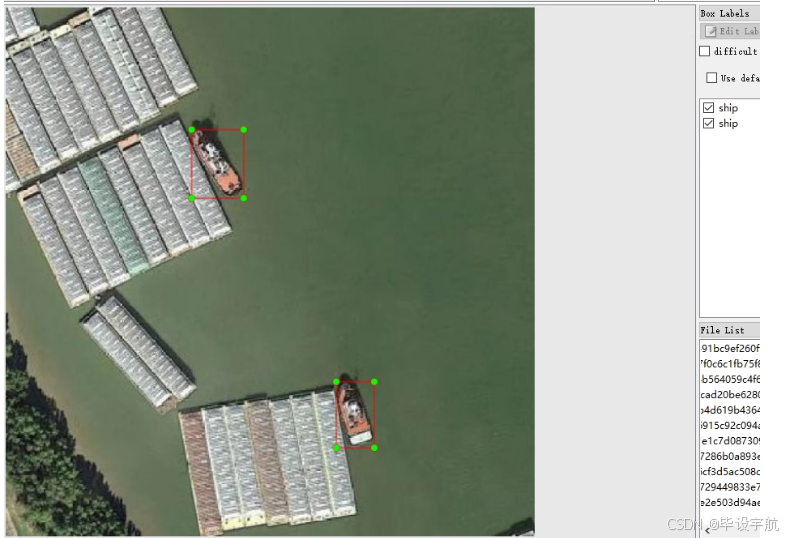
SIGTRD 是一个专门为卫星图像中的地面目标识别而设计的数据集,它包含了一系列常见的基础设施和交通工具类型。该数据集提供了1500张卫星图像,这些图像经过了增强处理,可以应对各种光照、天气和角度变化的情况。每个图像都有详细的标注信息,包括高速公路服务区、收费站、飞机、机场、棒球场、篮球场、桥梁、烟囱、大坝、高尔夫球场、跑道、港口、立交桥、船只、体育场、储油罐、网球场、火车站、车辆和风车等多种目标。数据集的设计目的是为了提高卫星图像分析的精度和效率,支持城市规划、交通管理和应急响应等领域的工作。
数据集特点
- 丰富的场景覆盖:数据集涵盖了多种常见的人工设施和自然景观,满足多样化的需求。
- 增强的图像质量:数据集中的图像经过增强处理,提高了在复杂环境下的识别效果。
- 详尽的标注信息:每张图像都进行了精确的标注,包括目标位置、尺寸和类别等重要信息。
- 易于使用:数据集已经按照YOLO格式整理,可以直接用于训练和评估YOLO系列的目标检测模型。
- 广泛的应用范围:适用于城市规划、交通管理、灾害监测等多个领域的研究与应用。
数据集构成
- 图像数量:总共有1500张卫星图像。
- 类别数:19类
 类别名称及对应数量:
Expressway-Service-area: 高速公路服务区 (143张)Expressway-toll-station: 收费站 (57张)airplane: 飞机 (301张)airport: 机场 (132张)baseballfield: 棒球场 (323张)basketballcourt: 篮球场 (157张)bridge: 桥梁 (117张)chimney: 烟囱 (66张)dam: 大坝 (80张)golffield: 高尔夫球场 (66张)groundtrackfield: 跑道 (124张)harbor: 港口 (304张)overpass: 立交桥 (121张)ship: 船只 (4448张)stadium: 体育场 (50张)storagetank: 储油罐 (298张)tenniscourt: 网球场 (648张)trainstation: 火车站 (77张)vehicle: 车辆 (2027张)windmill: 风车 (210张)
示例代码
以下是一个简单的Python脚本示例,用于加载数据集中的一对图像-标签对,并可视化其中的标注信息:
import os
import cv2
import numpy as np
import matplotlib.pyplot as plt
from matplotlib.patches import Rectangle

# 数据集目录路径
data_dir = 'path/to/sigtrd_dataset'
train_image_dir = os.path.join(data_dir, 'images/train')
train_label_dir = os.path.join(data_dir, 'labels/train')

# 选取一张训练图像及其对应标签
image_files = os.listdir(train_image_dir)
image_file = image_files[0]  # 假设取第一张图
label_file = os.path.splitext(image_file)[0] + '.txt'

image_path = os.path.join(train_image_dir, image_file)
label_path = os.path.join(train_label_dir, label_file)

# 加载图像
image = cv2.imread(image_path, cv2.IMREAD_COLOR)
height, width, _ = image.shape

# 解析YOLO格式标签
def parse_yolo_label(label_path, image_width, image_height):
    bboxes = []
    with open(label_path, 'r') as f:
        lines = f.readlines()
        for line in lines:
            class_id, x_center, y_center, box_width, box_height = map(float, line.strip().split())
            x_min = int((x_center - box_width / 2) * image_width)
            y_min = int((y_center - box_height / 2) * image_height)
            box_width = int(box_width * image_width)
            box_height = int(box_height * image_width)
            bboxes.append((class_id, x_min, y_min, box_width, box_height))

    return bboxes

# 解析标签
bboxes = parse_yolo_label(label_path, width, height)

# 可视化标注
fig, ax = plt.subplots(figsize=(10, 10))
ax.imshow(cv2.cvtColor(image, cv2.COLOR_BGR2RGB))
colors = ['#FFA500', '#00FFFF', '#00BFFF', '#EE82EE', '#F0E68C', '#ADD8E6', '#9ACD32', '#FFDAB9', '#00FA9A', '#DC143C', '#00FF7F', '#87CEFA', '#FF6347', '#4169E1', '#800080', '#FFD700', '#FF69B4', '#CD5C5C', '#008000', '#FF00FF']
names = ['Expressway-Service-area', 'Expressway-toll-station', 'airplane', 'airport', 'baseballfield', 'basketballcourt', 'bridge', 'chimney', 'dam', 'golffield', 'groundtrackfield', 'harbor', 'overpass', 'ship', 'stadium', 'storagetank', 'tenniscourt', 'trainstation', 'vehicle', 'windmill']
for bbox, color_name in zip(bboxes, colors):
    class_id, x, y, w, h = bbox
    rect = Rectangle((x, y), w, h, linewidth=2, edgecolor=color_name, facecolor='none')
    ax.add_patch(rect)
    ax.text(x, y - 10, names[int(class_id)], color=color_name, fontsize=8)

plt.title('Satellite Image Ground Target Recognition Dataset')
plt.axis('off')
plt.show()
数据集使用指南
-
数据准备:
- 确认数据集路径是否正确,并且图像和标签文件均存在指定的目录下。
- 检查数据集是否有损坏或缺失的文件,确保所有图像和对应的标注文件都是完整的。
-
数据集划分:
- 数据集已经划分为训练


 2253
2253

 被折叠的 条评论
为什么被折叠?
被折叠的 条评论
为什么被折叠?
 到【灌水乐园】发言


