


文章目录
实验代码针对天津大学、重庆理工大学化工原理实验教材设计,若有其他需求,请自行编辑
原始数据记录
| 序号 | 滤液高/cm | p=0.05MPa θ/s | p=0.05MPa Δθ/s | p=0.10MPa θ/s | p=0.10MPa Δθ/s | p=0.15MPa θ/s | p=0.15MPa Δθ/s |
|---|---|---|---|---|---|---|---|
| 0 | 5.0 | 0.00 | 0.00 | 0.00 | 0.00 | 0.00 | 0.00 |
| 1 | 6.0 | 17.68 | 17.68 | 14.60 | 14.60 | 9.04 | 9.04 |
| 2 | 7.0 | 57.88 | 40.20 | 35.61 | 21.01 | 25.70 | 16.66 |
| 3 | 8.0 | 117.64 | 59.76 | 64.53 | 28.91 | 48.74 | 23.04 |
| 4 | 9.0 | 183.41 | 65.77 | 94.71 | 30.17 | 73.95 | 25.21 |
| 5 | 10.0 | 261.36 | 77.95 | 135.71 | 41.00 | 106.55 | 32.60 |
| 6 | 11.0 | 359.70 | 98.34 | 183.58 | 47.87 | 141.28 | 34.73 |
| 7 | 12.0 | 470.81 | 111.11 | 237.58 | 53.99 | 182.11 | 40.83 |
| 8 | 13.0 | 600.73 | 129.92 | 296.65 | 59.06 | 225.95 | 43.84 |
| 9 | 14.0 | 857.51 | 256.78 | 381.12 | 84.47 | 280.95 | 55.00 |
| 10 | 14.5(第一组为14.5,二三组为15) | 3521.72 | 2664.21 | 813.05 | 431.92 | 401.56 | 120.61 |
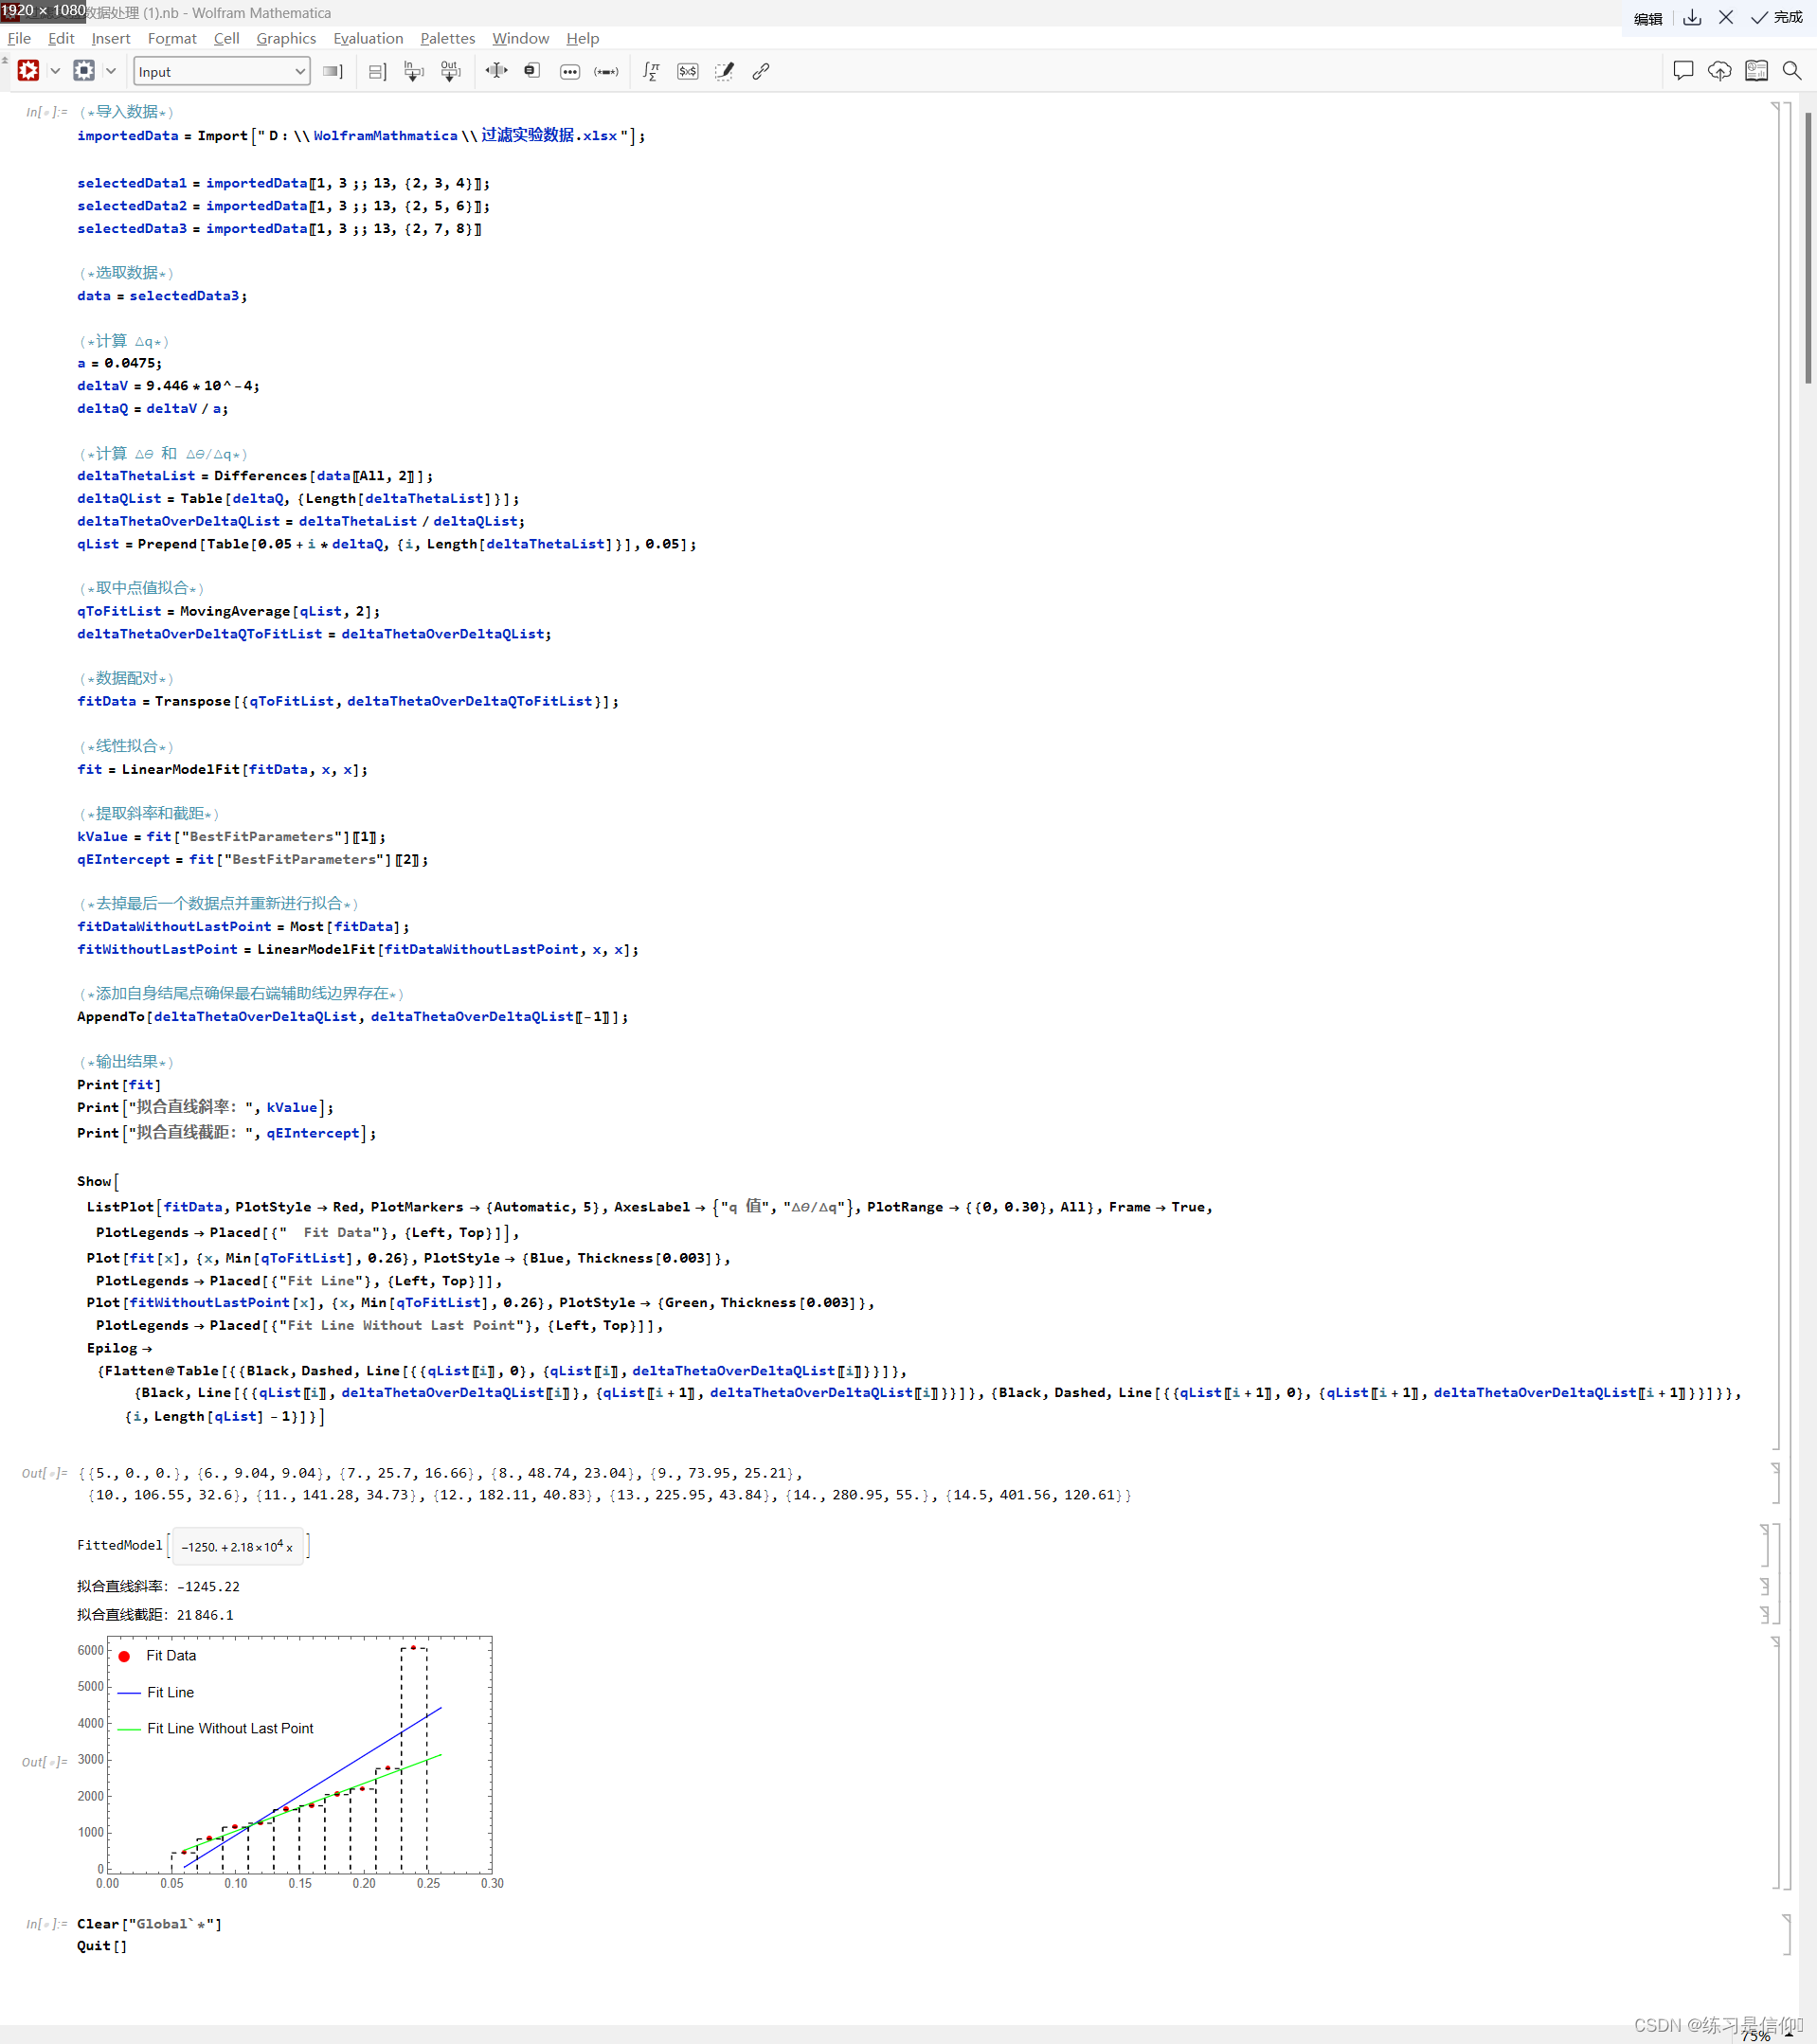
尝试:拿第一组实验数据建立基本流程
(*导入数据*)
importedData = Import[" D : \\ WolframMathmatica \\ 过滤实验数据 . xlsx "];

selectedData1 = importedData[[1, 3 ;; 13, {2, 3, 4}]];
selectedData2 = importedData[[1, 3 ;; 13, {2, 5, 6}]];
selectedData3 = importedData[[1, 3 ;; 13, {2, 7, 8}]]

(*选取数据*)
data = selectedData3;

(*计算 \[CapitalDelta]q*)
a = 0.0475;
deltaV = 9.446*10^-4;
deltaQ = deltaV/a;

(*计算 \[CapitalDelta]\[Theta] 和 \
\[CapitalDelta]\[Theta]/\[CapitalDelta]q*)
deltaThetaList = Differences[data[[All, 2]]];
deltaQList = Table[deltaQ, {Length[deltaThetaList]}];
deltaThetaOverDeltaQList = deltaThetaList/deltaQList;
qList = Prepend[Table[0.05 + i*deltaQ, {i, Length[deltaThetaList]}],
   0.05];

(*取中点值拟合*)
qToFitList = MovingAverage[qList, 2];
deltaThetaOverDeltaQToFitList = deltaThetaOverDeltaQList;

(*数据配对*)
fitData = Transpose[{qToFitList, deltaThetaOverDeltaQToFitList}];

(*线性拟合*)
fit = LinearModelFit[fitData, x, x];

(*提取斜率和截距*)
kValue = fit["BestFitParameters"][[1]];
qEIntercept = fit["BestFitParameters"][[2]];

(*去掉最后一个数据点并重新进行拟合*)
fitDataWithoutLastPoint = Most[fitData];
fitWithoutLastPoint = LinearModelFit[fitDataWithoutLastPoint, x, x];

(*添加自身结尾点确保最右端辅助线边界存在*)
AppendTo[deltaThetaOverDeltaQList, deltaThetaOverDeltaQList[[-1]]];

(*输出结果*)
Print[fit]
Print["拟合直线斜率:", kValue];
Print["拟合直线截距:", qEIntercept];

Show[
 ListPlot[fitData, PlotStyle -> Red, PlotMarkers -> {Automatic, 5},
  AxesLabel -> {"q 值", "\[CapitalDelta]\[Theta]/\[CapitalDelta]q"},
  PlotRange -> {{0, 0.30}, All}, Frame -> True,
  PlotLegends -> Placed[{"  Fit Data"}, {Left, Top}]],
 Plot[fit[x], {x, Min[qToFitList], 0.26},
  PlotStyle -> {Blue, Thickness[0.003]},
  PlotLegends -> Placed[{"Fit Line"}, {Left, Top}]],
 Plot[fitWithoutLastPoint[x], {x, Min[qToFitList], 0.26},
  PlotStyle -> {Green, Thickness[0.003]},
  PlotLegends ->
   Placed[{"Fit Line Without Last Point"}, {Left, Top}]],
 Epilog -> {Flatten@
    Table[{{Black, Dashed,
       Line[{{qList[[i]], 0}, {qList[[i]],
          deltaThetaOverDeltaQList[[i]]}}]}, {Black,
       Line[{{qList[[i]],
          deltaThetaOverDeltaQList[[i]]}, {qList[[i + 1]],
          deltaThetaOverDeltaQList[[i]]}}]}, {Black, Dashed,
       Line[{{qList[[i + 1]], 0}, {qList[[i + 1]],
          deltaThetaOverDeltaQList[[i + 1]]}}]}}, {i,
      Length[qList] - 1}]}]
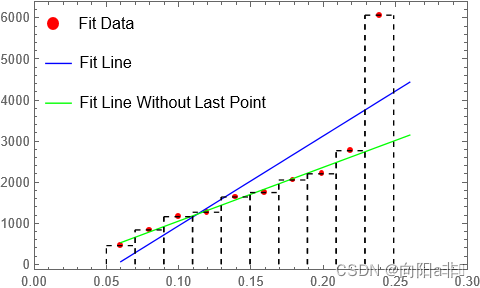
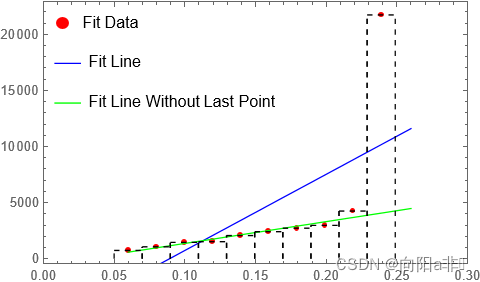
尝试:Mathmatica代码效果图
尝试:输出结果
| 参数 | 值 |
|---|---|
| 拟合直线斜率 | -1245.22 |
| 拟合直线截距 | 21846.1 |
函数化流程
(*函数:过滤实验拟合*)
FilterFitting[data_List] :=
 Module[{a, deltaV, deltaQ, deltaThetaList, deltaQList,
   deltaThetaOverDeltaQList, qList, qToFitList,
   deltaThetaOverDeltaQToFitList, fitData, fit,
   fitDataWithoutLastPoint, fitWithoutLastPoint, kValue, qEIntercept},
   a = 0.0475;
  deltaV = 9.446*10^-4;
  deltaQ = deltaV/a;
  deltaThetaList = Differences[data[[All, 2]]];
  deltaQList = Table[deltaQ, {Length[deltaThetaList]}];
  deltaThetaOverDeltaQList = deltaThetaList/deltaQList;
  qList =
   Prepend[Table[0.05 + i*deltaQ, {i, Length[deltaThetaList]}],
    0.05];
  qToFitList = MovingAverage[qList, 2];
  deltaThetaOverDeltaQToFitList = deltaThetaOverDeltaQList;
  fitData = Transpose[{qToFitList, deltaThetaOverDeltaQToFitList}];
  fit = LinearModelFit[fitData, x, x];
  kValue = fit["BestFitParameters"][[1]];
  qEIntercept = fit["BestFitParameters"][[2]];
  fitDataWithoutLastPoint = Most[fitData];
  fitWithoutLastPoint =
   LinearModelFit[fitDataWithoutLastPoint, x, x];
  AppendTo[deltaThetaOverDeltaQList, deltaThetaOverDeltaQList[[-1]]];
  {qToFitList, deltaThetaOverDeltaQToFitList, fitData, fit}]

(*函数:过滤实验作图*)
FilterPlot[data_List] :=
 Module[{a, deltaV, deltaQ, deltaThetaList, deltaQList,
   deltaThetaOverDeltaQList, qList, qToFitList,
   deltaThetaOverDeltaQToFitList, fitData, fit,
   fitDataWithoutLastPoint, fitWithoutLastPoint, kValue, qEIntercept,
   plot}, a = 0.0475;
  deltaV = 9.446*10^-4;
  deltaQ = deltaV/a;
  deltaThetaList = Differences[data[[All, 2]]];
  deltaQList = Table[deltaQ, {Length[deltaThetaList]}];
  deltaThetaOverDeltaQList = deltaThetaList/deltaQList;
  qList =
   Prepend[Table[0.05 + i*deltaQ, {i, Length[deltaThetaList]}],
    0.05];
  qToFitList = MovingAverage[qList, 2];
  deltaThetaOverDeltaQToFitList = deltaThetaOverDeltaQList;
  fitData = Transpose[{qToFitList, deltaThetaOverDeltaQToFitList}];
  fit = LinearModelFit[fitData, x, x];
  kValue = fit["BestFitParameters"][[1]];
  qEIntercept = fit["BestFitParameters"][[2]];
  fitDataWithoutLastPoint = Most[fitData];
  fitWithoutLastPoint =
   LinearModelFit[fitDataWithoutLastPoint, x, x];
  Print[fit];
  Print["拟合直线斜率:", kValue];
  Print["拟合直线截距:", qEIntercept];
  AppendTo[deltaThetaOverDeltaQList, deltaThetaOverDeltaQList[[-1]]];
  plot :=
   Show[ListPlot[fitData, PlotStyle -> Red,
     PlotMarkers -> {Automatic, 5},
     AxesLabel -> {"q 值", "\[CapitalDelta]\[Theta]/\[CapitalDelta]q"},
      PlotRange -> {{0, 0.30}, All}, Frame -> True,
     PlotLegends -> Placed[{" Fit Data"}, {Left, Top}]],
    Plot[fit[x], {x, Min[qToFitList], 0.26},
     PlotStyle -> {Blue, Thickness[0.003]},
     PlotLegends -> Placed[{"Fit Line"}, {Left, Top}]],
    Plot[fitWithoutLastPoint[x], {x, Min[qToFitList], 0.26},
     PlotStyle -> {Green, Thickness[0.003]},
     PlotLegends ->
      Placed[{"Fit Line Without Last Point"}, {Left, Top}]],
    Epilog -> {Flatten@
       Table[{{Black, Dashed,
          Line[{{qList[[i]], 0}, {qList[[i]],
             deltaThetaOverDeltaQList[[i]]}}]}, {Black,
          Line[{{qList[[i]],
             deltaThetaOverDeltaQList[[i]]}, {qList[[i + 1]],
             deltaThetaOverDeltaQList[[i]]}}]}, {Black, Dashed,
          Line[{{qList[[i + 1]], 0}, {qList[[i + 1]],
             deltaThetaOverDeltaQList[[i + 1]]}}]}}, {i,
         Length[qList] - 1}]}];
  plot]

(*导入数据*)
importedData = Import["D:\\WolframMathmatica\\过滤实验数据.xlsx"];
selectedData1 = importedData[[1, 3 ;; 13, {2, 3, 4}]];
selectedData2 = importedData[[1, 3 ;; 13, {2, 5, 6}]];
selectedData3 = importedData[[1, 3 ;; 13, {2, 7, 8}]];
{qToFitList1, deltaThetaOverDeltaQToFitList1, fitData1, fit1} =
  FilterFitting[selectedData1];
Print["拟合直线:", fit1];
plot1 = FilterPlot[selectedData1]

{qToFitList2, deltaThetaOverDeltaQToFitList2, fitData2, fit2} =
  FilterFitting[selectedData2];
Print["拟合直线:", fit2];
plot2 = FilterPlot[selectedData2]

{qToFitList3, deltaThetaOverDeltaQToFitList3, fitData3, fit3} =
  FilterFitting[selectedData3];
Print["拟合直线:", fit3];
plot3 = FilterPlot[selectedData3]
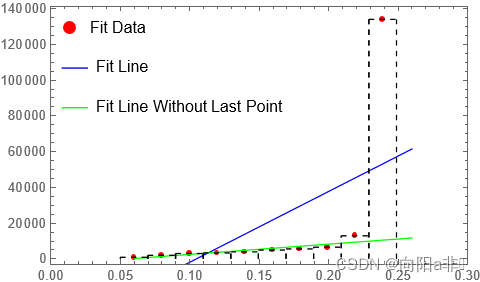
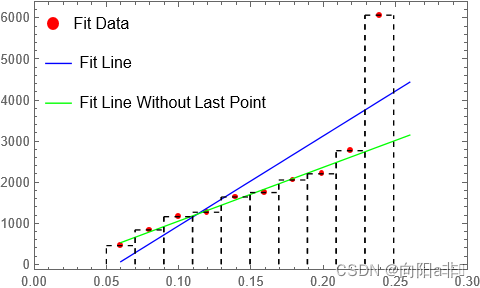
函数化流程:Mathmatica代码效果图
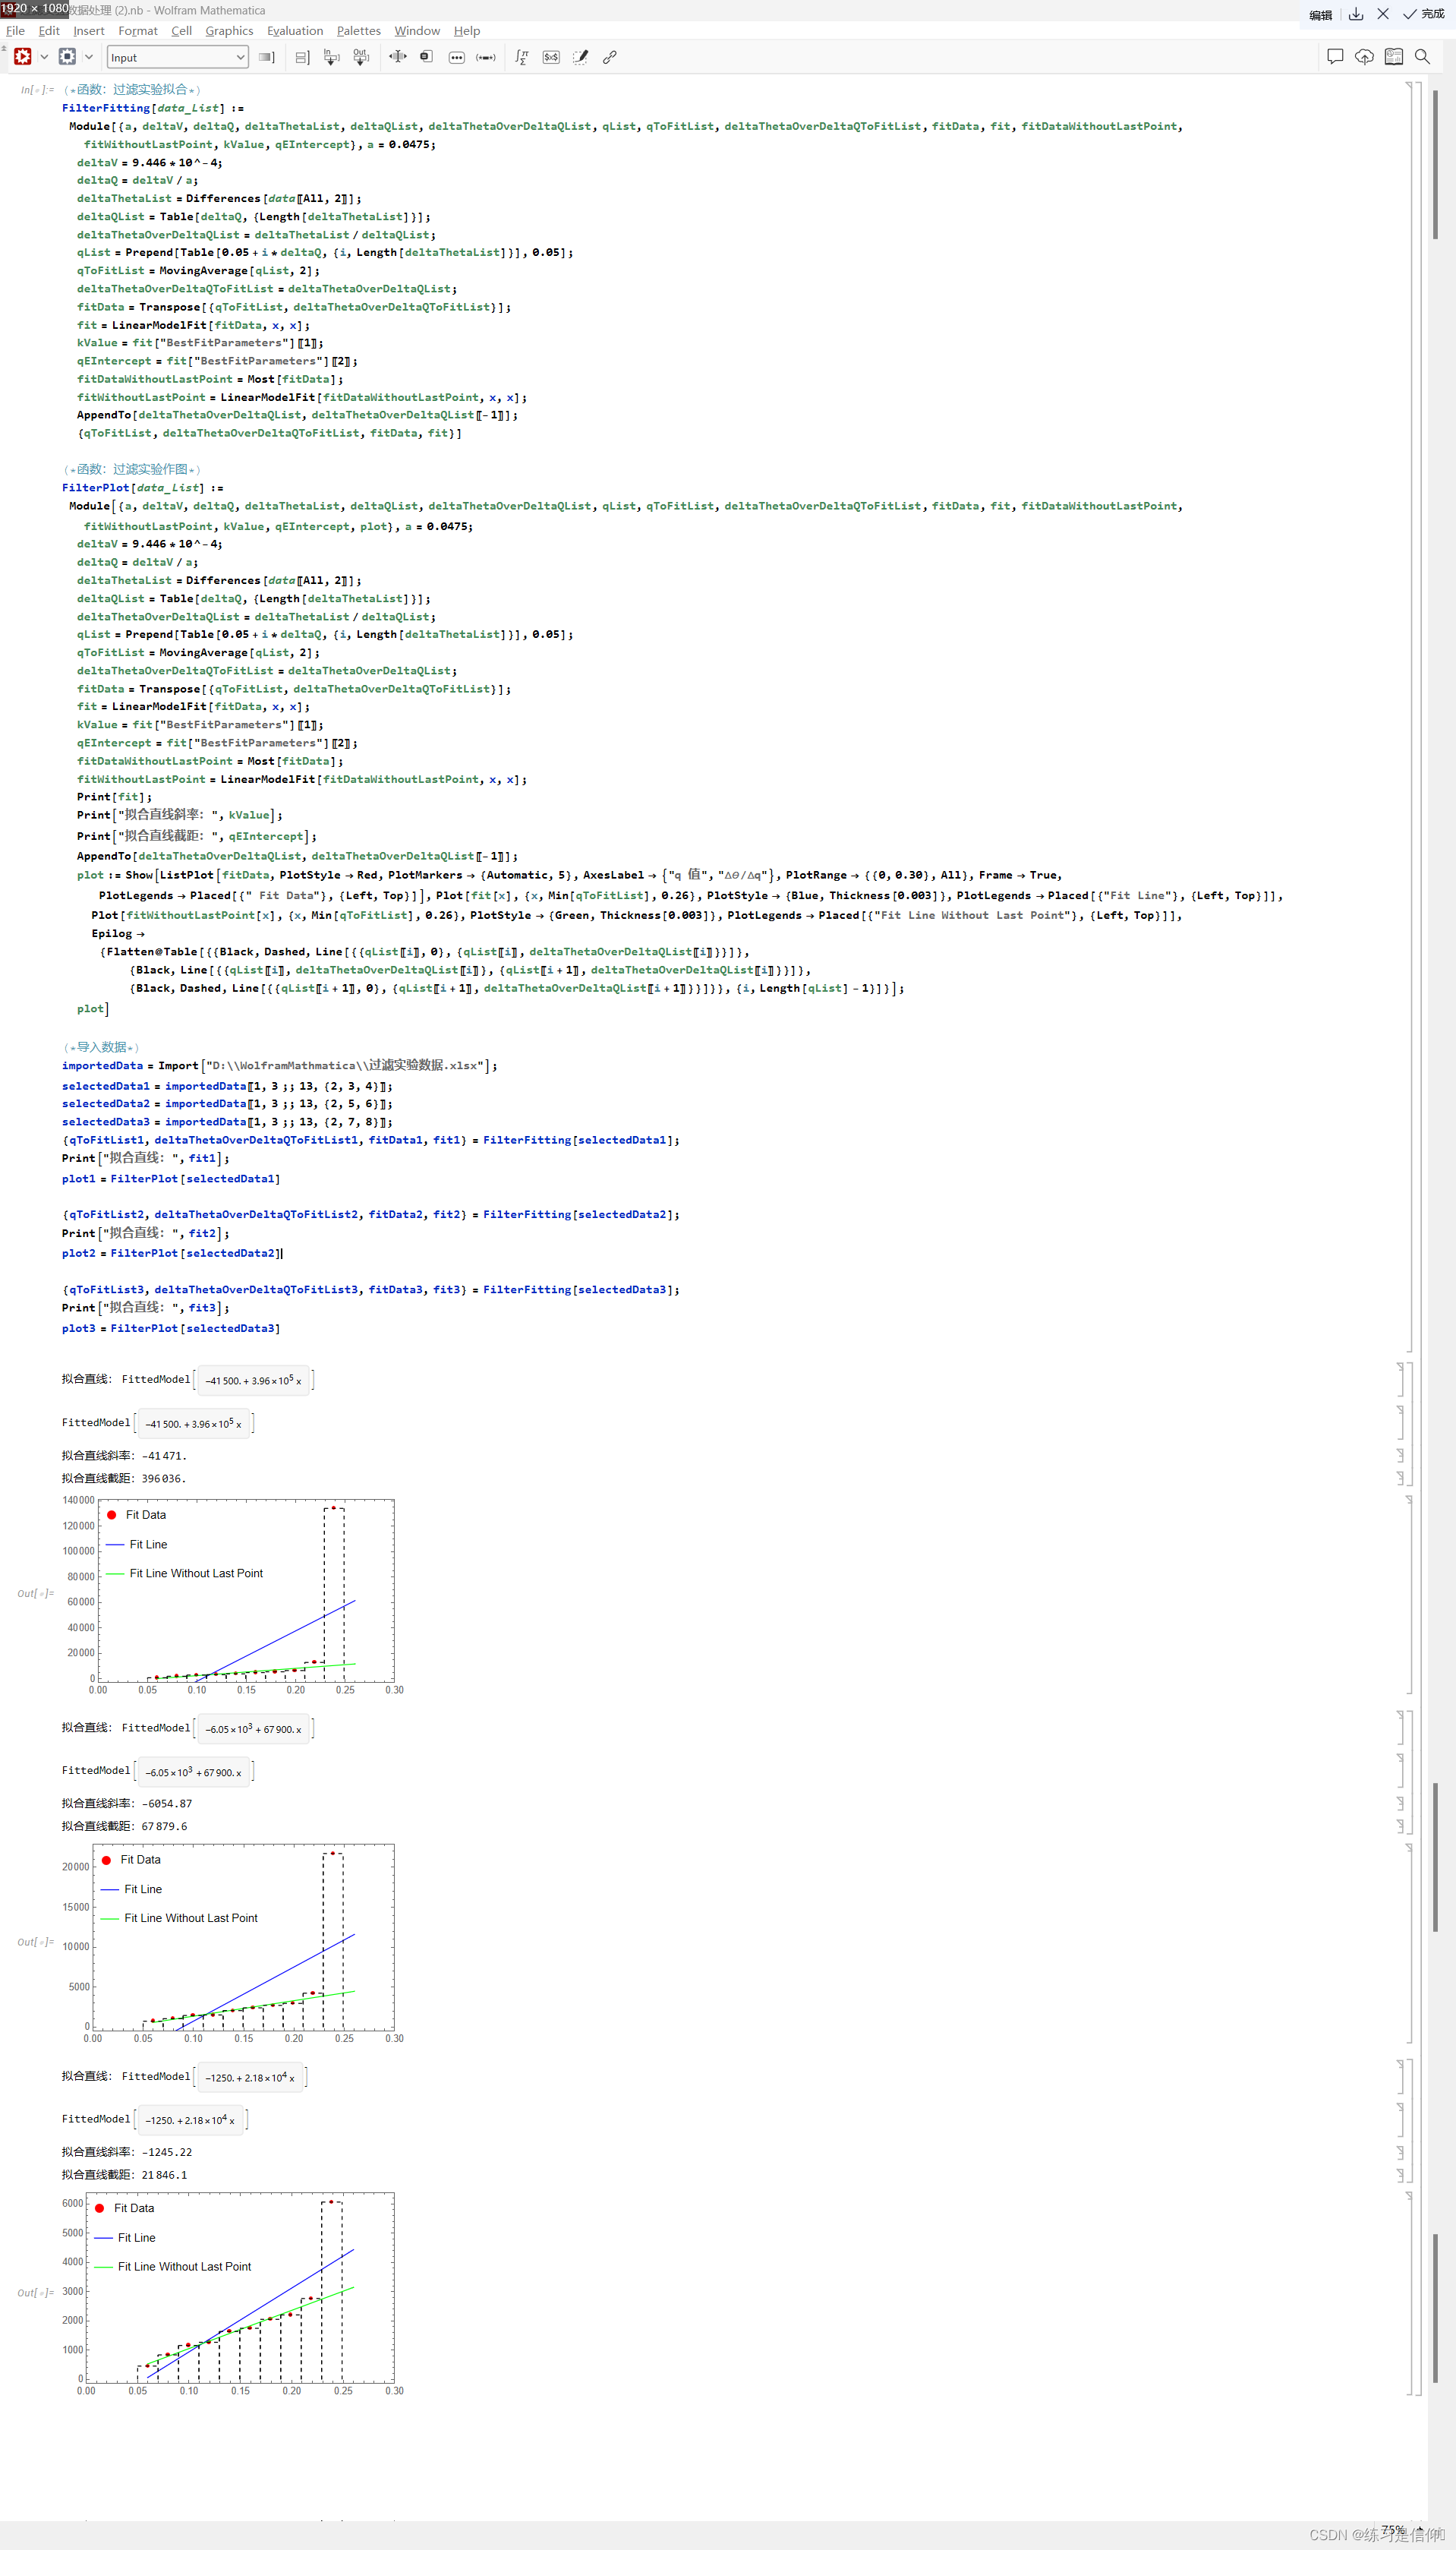
函数化流程:输出结果
| 拟合直线斜率 | 拟合直线截距 |
|---|---|
| -41471. | 396036. |
| 拟合直线斜率 | 拟合直线截距 |
|---|---|
| -6054.87 | 67879.6 |
| 拟合直线斜率 | 拟合直线截距 |
|---|---|
| -1245.22 | 21846.1 |
函数功能去重
Clear["Global`*"]

FilterfitLineting[selectedData_List] :=
 Module[
  {a, deltaV, deltaQ, deltaThetaList, deltaQList,
   deltaThetaOverDeltaQList, qList, qMeanTofitLineList,
   deltaThetaOverDeltaqMeanTofitLineList, fitCoordinates, fitLine,
   fitCoordinatesWithoutLastPoint, fitLineWithoutLastPoint, kValue,
   qEIntercept}, a = 0.0475;
  deltaV = 9.446*10^-4;
  deltaQ = deltaV/a;
  deltaThetaList = Differences[selectedData[[All, 2]]];
  deltaQList = Table[deltaQ, {Length[deltaThetaList]}];
  deltaThetaOverDeltaQList = deltaThetaList/deltaQList;
  qList =
   Prepend[Table[0.05 + i*deltaQ, {i, Length[deltaThetaList]}],
    0.05];
  qMeanTofitLineList = MovingAverage[qList, 2];
  deltaThetaOverDeltaqMeanTofitLineList = deltaThetaOverDeltaQList;
  fitCoordinates =
   Transpose[{qMeanTofitLineList,
     deltaThetaOverDeltaqMeanTofitLineList}];
  fitLine = LinearModelFit[fitCoordinates, x, x];
  kValue = fitLine["BestFitParameters"][[1]];
  qEIntercept = fitLine["BestFitParameters"][[2]];
  fitCoordinatesWithoutLastPoint = Most[fitCoordinates];
  fitLineWithoutLastPoint =
   LinearModelFit[fitCoordinatesWithoutLastPoint, x, x];
  AppendTo[deltaThetaOverDeltaQList, deltaThetaOverDeltaQList[[-1]]];
  {a, deltaV, deltaQ, deltaThetaList, deltaQList,
   deltaThetaOverDeltaQList, qList, qMeanTofitLineList,
   deltaThetaOverDeltaqMeanTofitLineList, fitCoordinates, fitLine,
   fitCoordinatesWithoutLastPoint, fitLineWithoutLastPoint, kValue,
   qEIntercept}]
FilterPlot[selectedData_List, fitCoordinates_, fitLine_,
  fitLineWithoutLastPoint_, qMeanTofitLineList_] :=
 Module[
  {plot},
  plot =
   Show[ListPlot[fitCoordinates, PlotStyle -> Red,
     PlotMarkers -> {Automatic, 5},
     AxesLabel -> {"q 值", "\[CapitalDelta]\[Theta]/\[CapitalDelta]q"},
      PlotRange -> {{0, 0.30}, All}, Frame -> True,
     PlotLegends -> Placed[{" fitLine selectedData"}, {Left, Top}]],
    Plot[fitLine[x], {x, Min[qMeanTofitLineList], 0.26},
     PlotStyle -> {Blue, Thickness[0.003]},
     PlotLegends -> Placed[{"fitLine Line"}, {Left, Top}]],
    Plot[fitLineWithoutLastPoint[x], {x, Min[qMeanTofitLineList],
      0.26}, PlotStyle -> {Green, Thickness[0.003]},
     PlotLegends ->
      Placed[{"fitLine Line Without Last Point"}, {Left, Top}]],
    Epilog -> {Flatten@
       Table[{{Black, Dashed,
          Line[{{qList[[i]], 0}, {qList[[i]],
             deltaThetaOverDeltaQList[[i]]}}]}, {Black,
          Line[{{qList[[i]],
             deltaThetaOverDeltaQList[[i]]}, {qList[[i + 1]],
             deltaThetaOverDeltaQList[[i]]}}]}, {Black, Dashed,
          Line[{{qList[[i + 1]], 0}, {qList[[i + 1]],
             deltaThetaOverDeltaQList[[i + 1]]}}]}}, {i,
         Length[qList] - 1}]}];
  Print[fitLine];
  Print["拟合直线斜率:", fitLine["BestFitParameters"][[1]]];
  Print["拟合直线截距:", fitLine["BestFitParameters"][[2]]];
  {plot}]

importedData = Import["D:\\WolframMathmatica\\过滤实验数据.xlsx"];
plots = {};
Do[
 selectedData = importedData[[1, 3 ;; 13, {2, 3 + 2 i, 4 + 2 i}]];
 {a, deltaV, deltaQ, deltaThetaList, deltaQList,
   deltaThetaOverDeltaQList, qList, qMeanTofitLineList,
   deltaThetaOverDeltaqMeanTofitLineList, fitCoordinates, fitLine,
   fitCoordinatesWithoutLastPoint, fitLineWithoutLastPoint, kValue,
   qEIntercept} = FilterfitLineting[selectedData];
 plot = FilterPlot[selectedData, fitCoordinates, fitLine,
   fitLineWithoutLastPoint, qMeanTofitLineList];
 AppendTo[plots, plot];, {i, 0, 2}
 ]
plots
函数功能去重:Mathmatica代码效果图
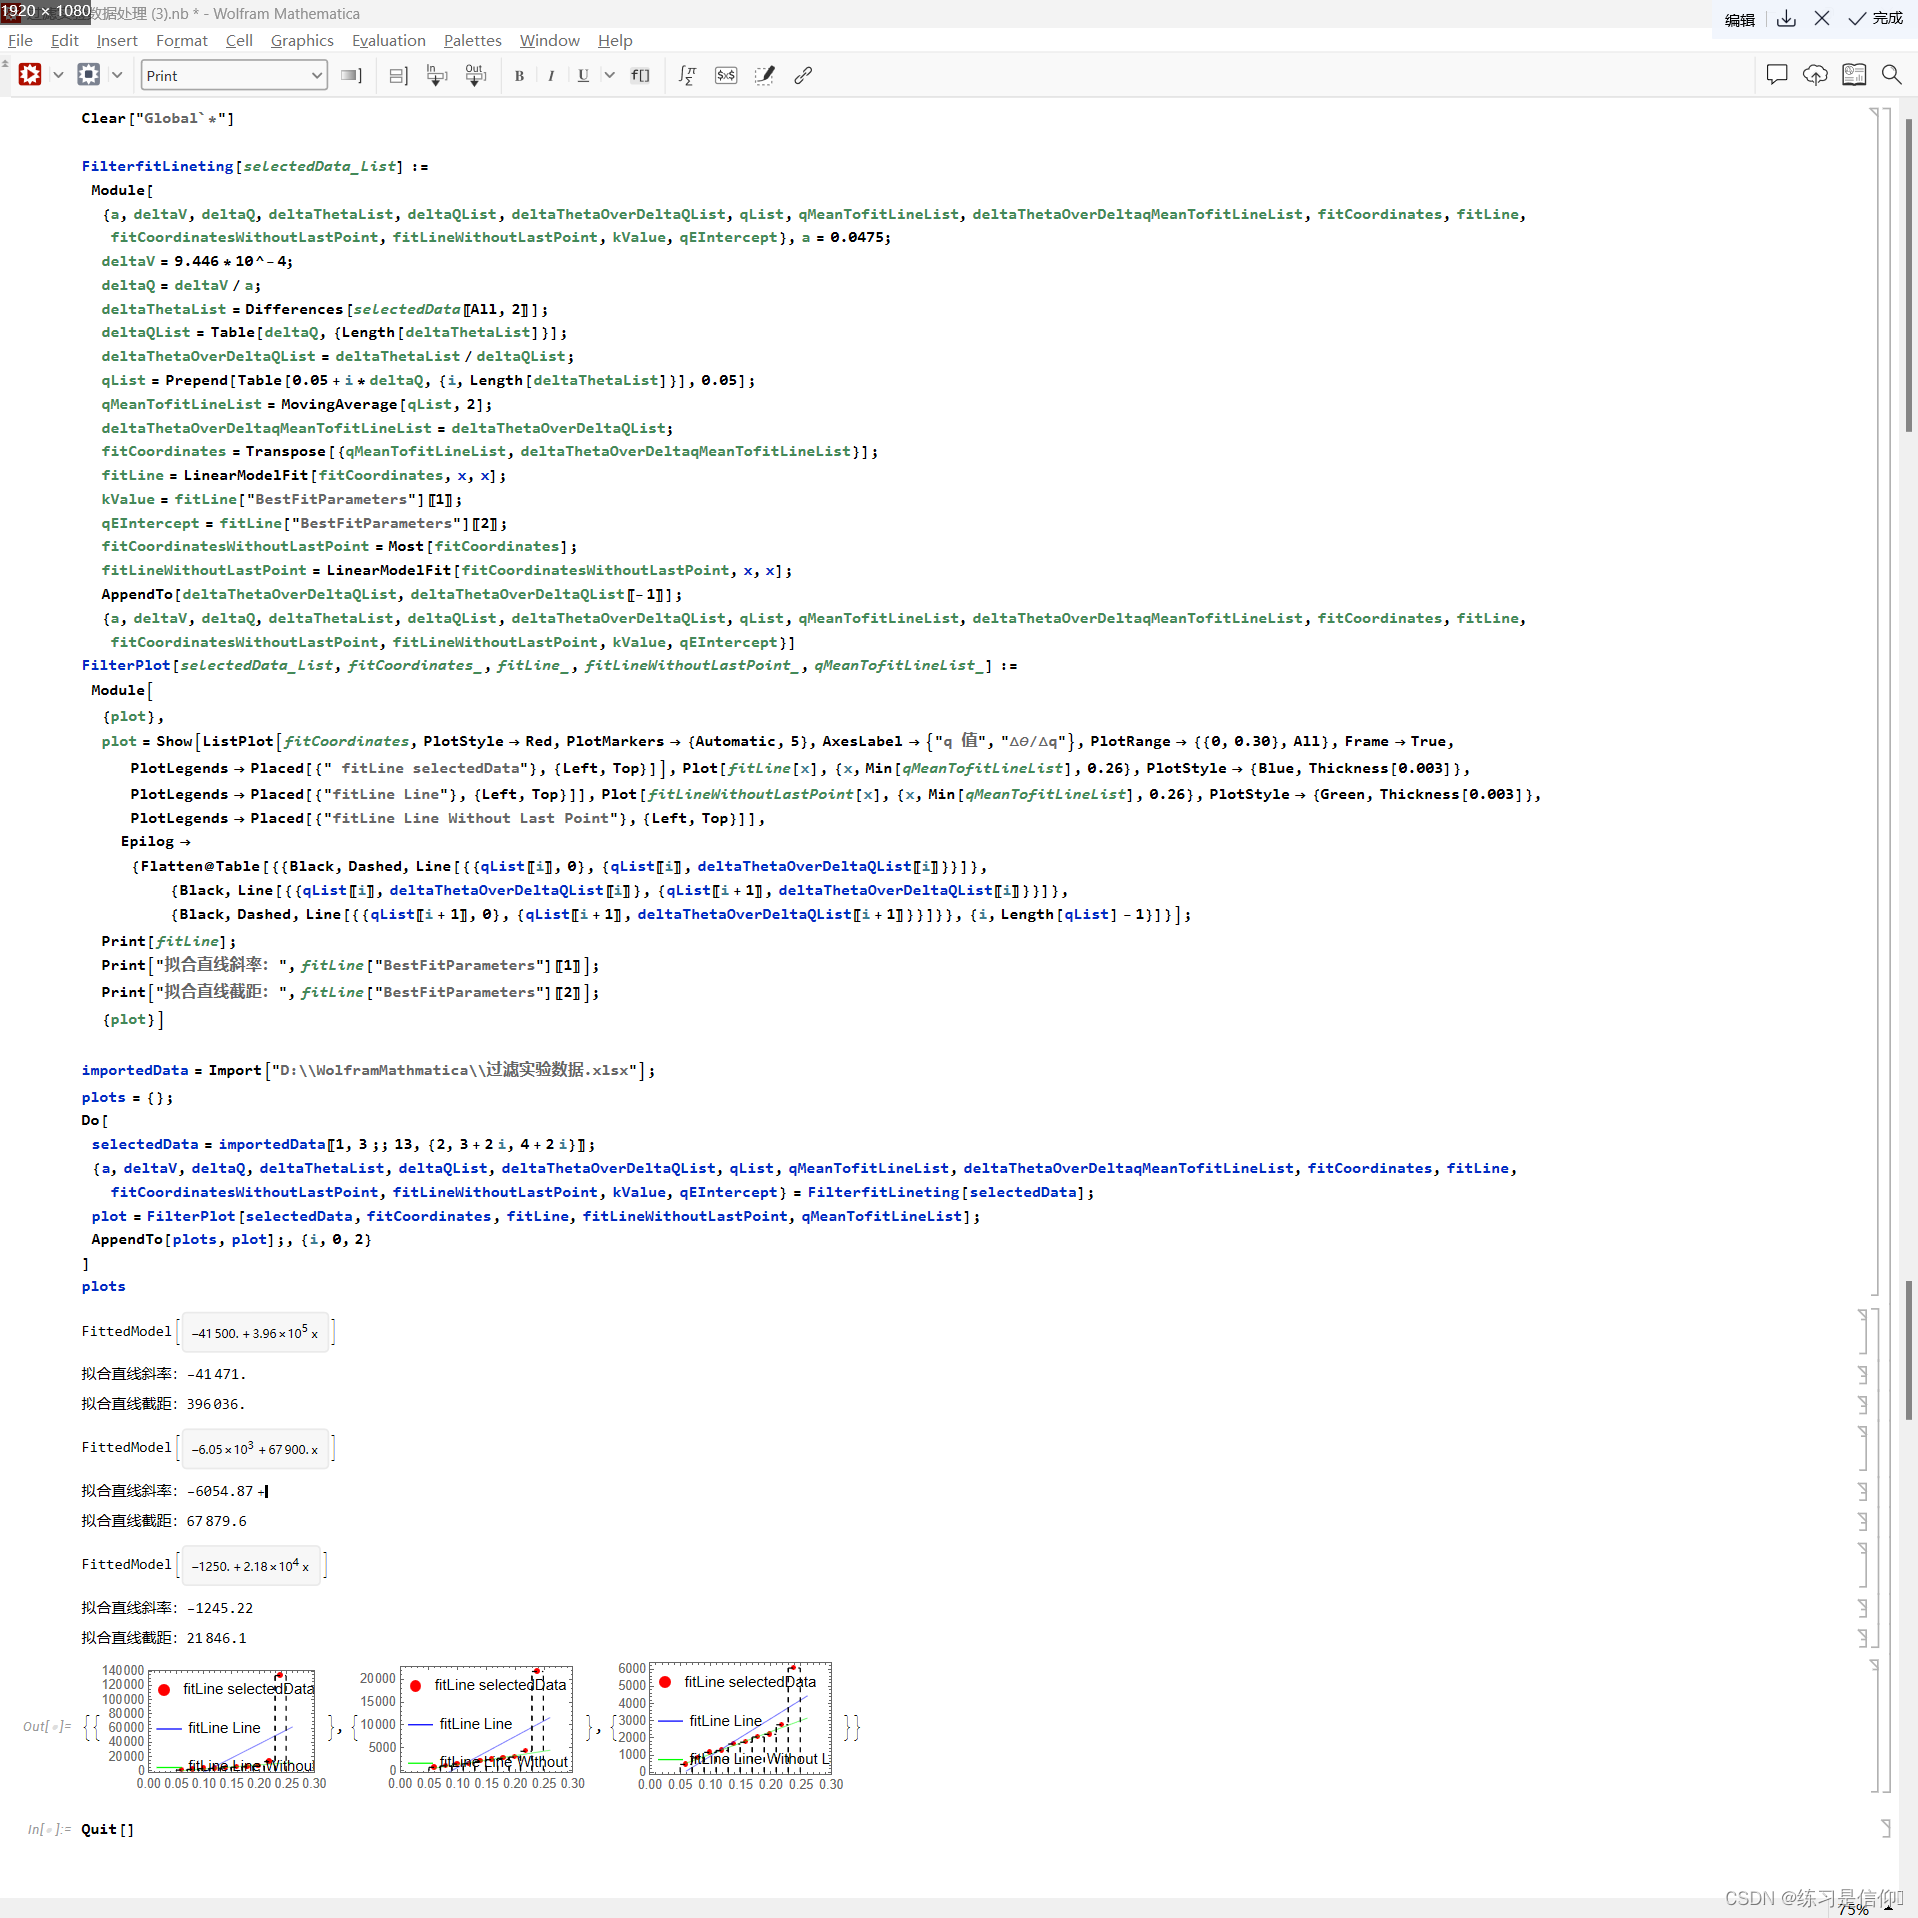
函数功能去重:输出结果
| 拟合直线斜率 | 拟合直线截距 |
|---|---|
| -41471. | 396036. |
| 拟合直线斜率 | 拟合直线截距 |
|---|---|
| -6054.87 | 67879.6 |
| 拟合直线斜率 | 拟合直线截距 |
|---|---|
| -1245.22 | 21846.1 |
需要注意的是,若尝试在同一坐标轴下展示所有图形,可能报错


 1967
1967


 被折叠的 条评论
为什么被折叠?
被折叠的 条评论
为什么被折叠?
 到【灌水乐园】发言


