


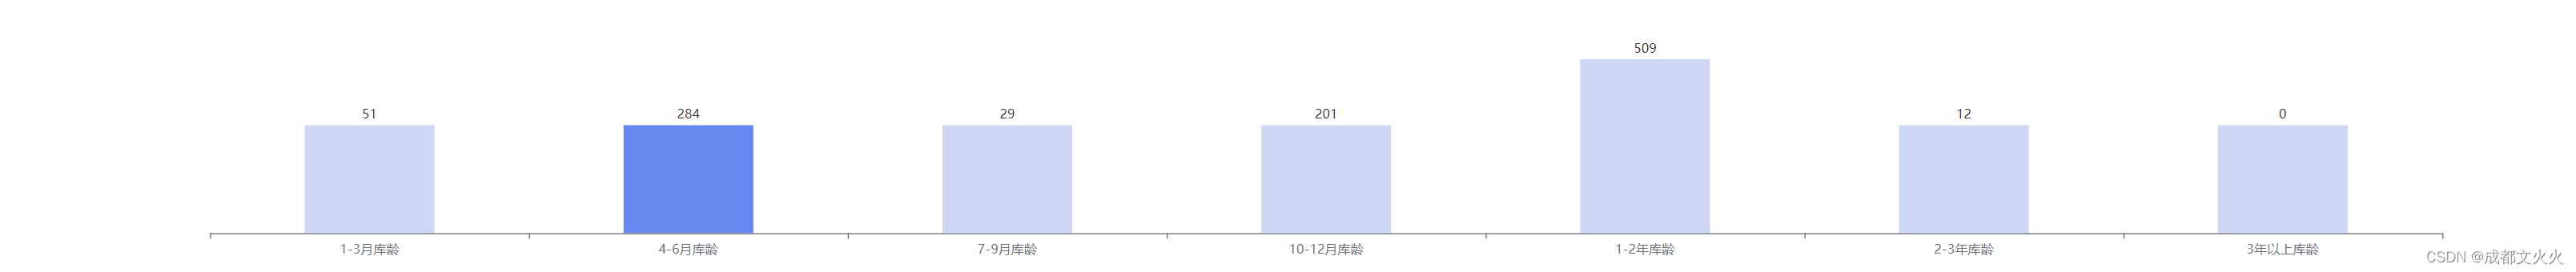
点击树状图获取树状图key来查询tbale表格功能:
效果如下:
showChart方法里面
// 监听柱状图点击事件给点击到的加颜色,最后通过emit传给父组件来获取数据
  myChart.on('click', (params: any) => {
      if (params && params.dataIndex !== undefined) {
        clickedIndex = params.dataIndex;
        // console.log(`点击了第 ${params.dataIndex} 个柱子`);
        // console.log(params.name);
        key.value = params.name;
        // console.log(key.value);

        // 更新柱状图颜色和样式
        myChart.setOption({
          series: [
            {
              itemStyle: {
                color: (params: any) => {
                  // 根据数据索引决定颜色
                  return params.dataIndex === clickedIndex
                    ? 'rgba(92, 123, 217, 1)'
                    : 'rgba(92, 123, 217, 0.3)';
                },
              },
            },
          ],
        });
      }
      emit('key-clicked', key);
    });
完整的树状图组件代码如下:
<template>
  <PageWrapper dense fixedHeight contentFullHeight>
    <!-- <h6 class="h6">{{ infoecharts.title }}</h6>// -->
    <h6 class="h6">库龄报表</h6>
    <div class="top-chart">
      <div id="main" ref="chartContainer" class="chart-container"></div>
    </div>
  </PageWrapper>
</template>
<script lang="ts" setup name="Reporttree">
  import {
    defineComponent,
    inject,
    watch,
    onMounted,
    PropType,
    onUnmounted,
    defineProps,
    ref,
    shallowRef,
    nextTick,
    toRefs,
    defineExpose,
    defineEmits,
  } from 'vue';
  import echarts from '/@/utils/lib/echarts';
  // 父组件传过来数据
  const emit = defineEmits(['key-clicked']);
  let clickedIndex = null;
  const props = defineProps({
    infoecharts: Array,
  });
  //使用父组件传递过来的值
  // console.log('props', props.infoecharts);

  const chartContainer = ref<HTMLElement | null>(null);
  const key = ref();
  const showChart = () => {
    if (!chartContainer.value) return;
    // console.log(props.infoecharts);
    const myChart = echarts.init(chartContainer.value);
    const xAxisData = props.infoecharts.map((val) => {
      return val.key;
    });
    const data2 = props.infoecharts.map((i) => {
      return i.value;
    });
    const data1 = data2.map((value) => Math.abs(value));

    const option = {
      xAxis: {
        type: 'category',
        data: xAxisData,
      },
      yAxis: {
        type: 'value',
        show: false,
      },
      series: [
        {
          barMinHeight: 100, // 设置高度最小值为200
          data: data1,
          type: 'bar',
          label: {
            show: true,
            position: 'top',
            formatter: (params: any) => {
              const value = data2[params.dataIndex];
              return value;
            },
          },

          barWidth: 120,
          barGap: '50%',
          itemStyle: {
            color: (params: any) => {
              // 根据数据索引决定颜色
              return params.dataIndex === 0 ? 'rgba(92, 123, 217, 1)' : 'rgba(92, 123, 217, 0.3)';
            },
          },
        },
      ],
    };
    myChart.setOption(option);

    // 监听柱状图点击事件
    myChart.on('click', (params: any) => {
      if (params && params.dataIndex !== undefined) {
        clickedIndex = params.dataIndex;
        // console.log(`点击了第 ${params.dataIndex} 个柱子`);
        // console.log(params.name);
        key.value = params.name;
        // console.log(key.value);

        // 更新柱状图颜色和样式
        myChart.setOption({
          series: [
            {
              itemStyle: {
                color: (params: any) => {
                  // 根据数据索引决定颜色
                  return params.dataIndex === clickedIndex
                    ? 'rgba(92, 123, 217, 1)'
                    : 'rgba(92, 123, 217, 0.3)';
                },
              },
            },
          ],
        });
      }
      emit('key-clicked', key);
    });

    // 监听窗口变化,自适应图表大小
    window.addEventListener('resize', () => {
      myChart.resize();
    });

    // 在组件销毁时销毁图表
    onUnmounted(() => {
      myChart.dispose();
    });
  };

  watch(
    () => props.infoecharts,
    () => {
      showChart();
    },
    { immediate: true },
  );

  onMounted(() => {
    // showChart();
  });
  defineExpose({
    showChart,
  });
</script>

<style lang="less" scoped>
  .h6 {
    position: absolute;
    left: 5px;
  }

  .top-chart {
    width: 100%;
    display: flex;
    align-items: center;
    justify-content: center;

    .chart-container {
      height: 320px;
      width: 100vw;
    }
  }
</style>
父组件绑定emit事件:
 <Reporttree :infoecharts="infodatas" ref="ReporttreeRef" @key-clicked="getkey" />


<script lang="ts" setup name="InventoryAgeReport">
const getkey = (clickedKey) => {
    key.value = clickedKey;
  };
</script>


 1482
1482

 被折叠的 条评论
为什么被折叠?
被折叠的 条评论
为什么被折叠?
 到【灌水乐园】发言


