


mplot3d 概述:
mplot3d是matplotlib中专门绘制3D图表的工具包,它主要包含一个继承自Axes的子类 Axes3D、使用Axes3D类可以构建一个三维坐标系的绘图区域。matplotlib可以通过两种方式创建Axes3D类的对象:一种方式是Axes3DO方法,另一种方式是add_subplot0方法。
1.Axes3D()方法
Axes3DO是构造方法,它直接用于构建一个Axes3D类的对象,Axes3DO方法的语法格式如下所示:
Axes3D (fig,rect-None,*args, azim--60, elev-30,zscale=None,
sharez-Ncne, proj_type='persp', **kwargs)
该方法的参数fig表示所属画布,rect表示确定三维坐标系位置的元组。创建Axes3D类对象的示例代码如下:
import matplotlib.pyplot as plt
from mpl_ toolkits.mplot3d import Axes3D
fig=plt.figure ()
ax=Axes3D (fig)
2.add_subplot()方法
在调用add_subplot)方法添加绘图区域时为该方法传入projection='3d',即指定坐标系的类型为三维坐标系,返回一个Axes3D类的对象。
创建Axes3D类对象的示例代码如下:
import matplotlib.pyplot as plt
from mpl_toolkits.mplot3d import Axes3D
fig = plt.figure ( )
ax = fig.add_subplot(111, projection='3d')
animation概述
matplotlib在1.1版本的标准库中加入了动画模块animation,使用该模块的Animation类可以实现一些基本的动画效果。Animation类是一个动画基类,它针对不同的行为分别派生了不同的子类,主要包括FuncAnimation类和Artist Animation类。其中,FuncAnimation类表示基于重复调用一个函数的动画;ArtistAnimation类表示基于一组固定Artist(标准的绘图元素,比如文本、线条、矩形等)对象的动画。具体说明如下。
1. FuncAnimation 类
FuncAnimation是基于函数的动画类,它通过重复调用同一函数来制作动画。 FuncAnimation类的构造方法的语法格式如下所示:
FuncAnimation (fig, func, frames-None, init_func=None, fargs=None,
save_count=None, *, cache frame data=True,**kwargs)
该方法常用参数的含义如下:
fig:表示动画所在的画布。
.func : 表示每帧动画调用的函数。
.frames : 表示动画的长度(一次动画包含的帧数)。
·init_func :表示用于开始绘制帧的函数,它会在第一帧动画之前调用一次。若未设置该参数,则程序将使用frames序列中第一项的绘图结果。
.fargs : 表示传递给 func 函数的其他参数。
·interval :表示更新动画的频率,以毫秒为单位,默认为200。
.blit :表示是否更新所有的点,默认为False。官方推荐将blit 参数设为True,但建议 macOS 的用户将 blit 参数设为False,否则将无法显示动画。
import numpy as np
import matplotlib.pyplot as plt
import matplotlib.animation as animation

# 0. 设置中文黑体
plt.rcParams["font.sans-serif"] = ["SimHei"]
plt.rcParams["axes.unicode_minus"] = False


# 1. 准备正弦曲线数据
x = np.linspace(0, 2*np.pi, 100)
y = np.sin(x)


# 2. 创建画布和坐标系
fig = plt.figure(tight_layout=True)
ax = fig.add_subplot(111)

# 3. 绘制正弦曲线
ax.plot(x, y)


# 4. 动画设计

def update_points(num):
    point_ani.set_data(x[num], y[num])    # num代表当前动画第几帧
    text_pt.set_text("x=%.3f, y=%.3f"%(x[num], y[num]))
    return point_ani,text_pt,

x = np.linspace(0, 2*np.pi, 100)
y = np.sin(x)

plt.plot(x,y)
point_ani,= plt.plot(x[0], y[0], "ro")
text_pt = plt.text(4, 0.8, '', fontsize=16)

# 制作动画
ani = animation.FuncAnimation(fig, update_points, np.arange(0, 100), interval=100, blit=True)

# 6.展示图表
plt.show()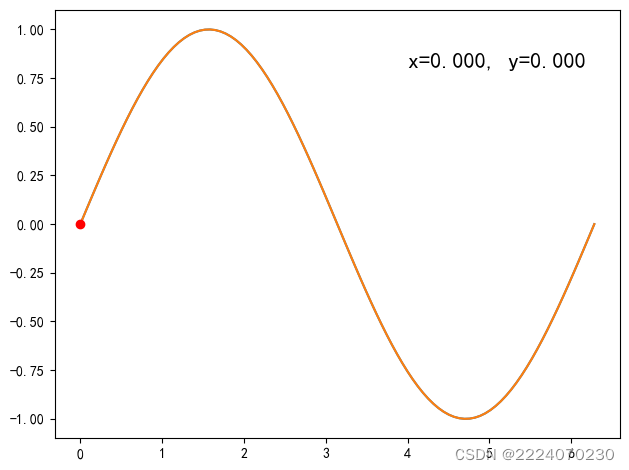


 2796
2796


 被折叠的 条评论
为什么被折叠?
被折叠的 条评论
为什么被折叠?
 到【灌水乐园】发言


