


在Tikz中我们一般使用\legend指令来进行图例的标识,下面是一些图例的学习
一、图例的位置调整
首先先给一个完整的Tikz代码(大家可以用它来进行练手)
\documentclass[tikz,border=10pt]{standalone}
\usepackage{tikz}
\usepackage{pgfplots}
\pgfplotsset{compat=1.18}

\begin{document}
\begin{tikzpicture}
    \begin{axis}[
        axis lines = middle,
        xlabel = \(x\),
        ylabel = {\(y\)},
        xmin=-3,
        xmax=3,
        ymin=-2,
        ymax=8,
        legend pos = north west
    ]
        % 绘制 f(x)=2^x
        \addplot[
            domain=-3:3,
            samples=100,
            color=blue,
            thick
        ] {2^x};
        \addlegendentry{\(f(x)=2^x\)}

        % 绘制 g(x)= -x^2 + 1
        \addplot[
            domain=-3:3,
            samples=100,
            color=red,
            thick
        ] {-x^2 + 1};
        \addlegendentry{\(g(x)= -x^2 + 1\)}

        % 近似计算交点
        \pgfmathsetmacro{\intersectionX}{-0.444} % 近似交点 x 坐标
        \pgfmathsetmacro{\intersectionY}{2^\intersectionX} % 对应的 y 坐标

        % 标记交点
        \filldraw[black] (\intersectionX,\intersectionY) circle (2pt);
        \node[above right] at (\intersectionX,\intersectionY) {$\text{交点}$};
          \filldraw[black] (0,1) circle (2pt) node[anchor=north] ;
    \end{axis}
\end{tikzpicture}
\end{document}
所画出的图为如下:
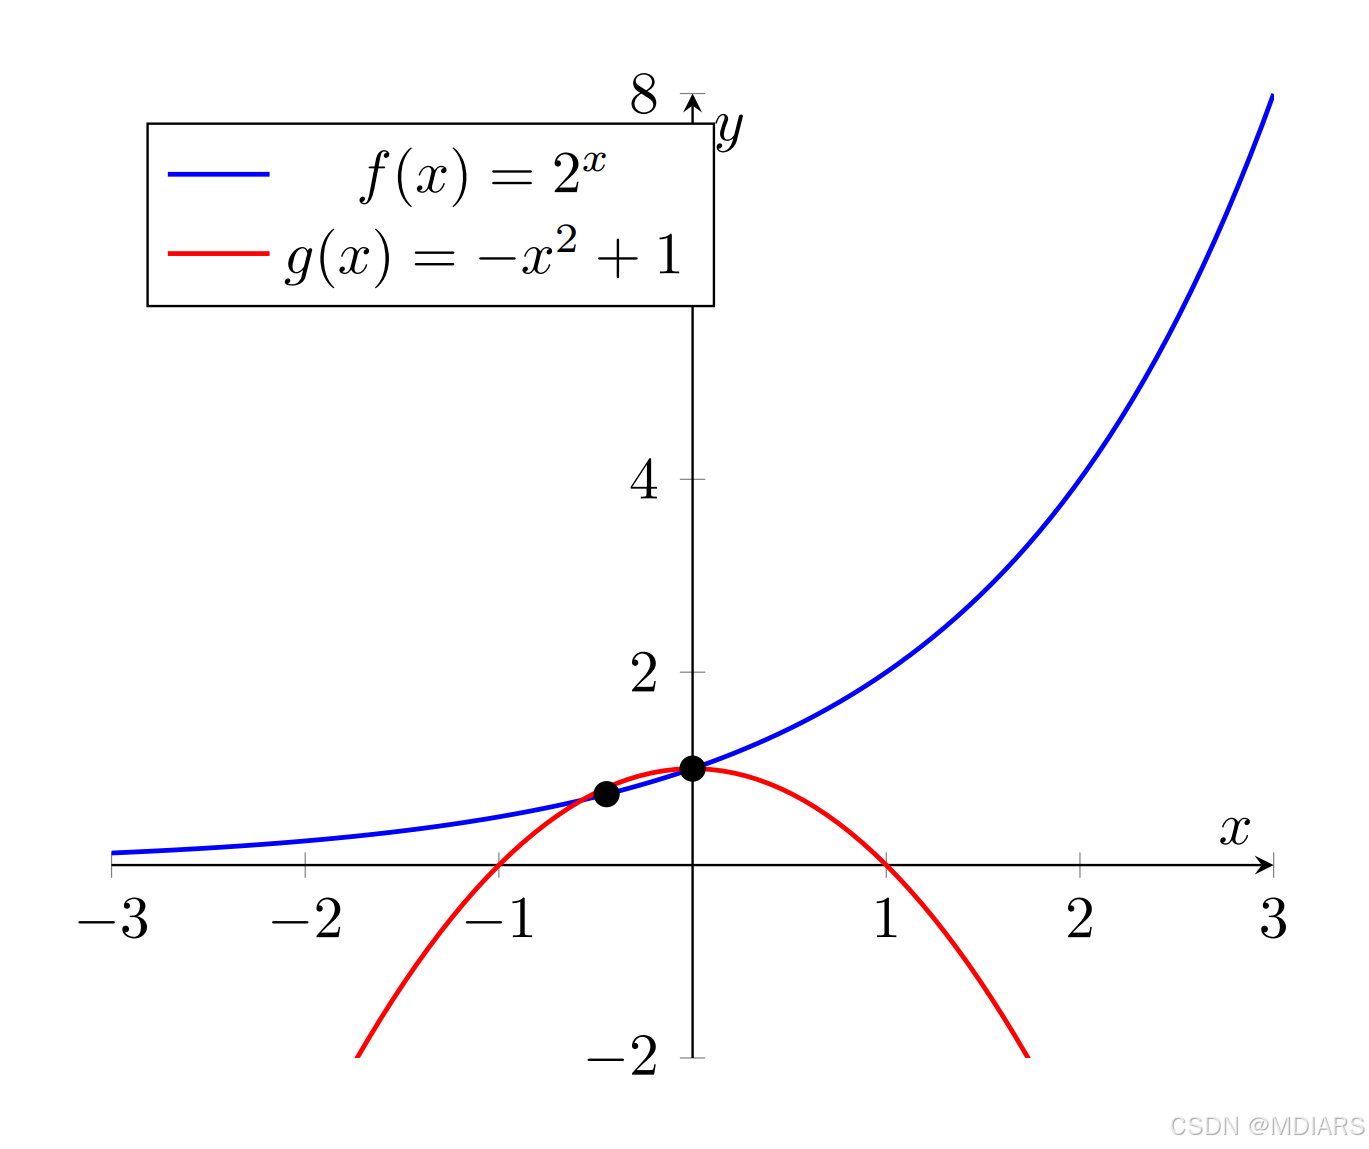
在上述代码中,画图例的代码为:legend pos = north west
但是在该图中,我们能发现一个明显的不正常的地方:图例盖住了y轴,那么此时我们就需要对图例进行调整与完善。
1.1 图例的大体位置调整
要让图例标签不挡住 y 轴,可以通过调整 legend pos(图例位置)来实现。例如,将图例位置设置为 north east(东北方向),这样图例就会在图的右上角,不会挡住 y 轴。以下是修改后的代码:
\documentclass[tikz,border=10pt]{standalone}
\usepackage{tikz}
\usepackage{pgfplots}
\pgfplotsset{compat=1.18}

\begin{document}
\begin{tikzpicture}
    \begin{axis}[
        axis lines = middle,
        xlabel = \(x\),
        ylabel = {\(y\)},
        xmin=-3,
        xmax=3,
        ymin=-2,
        ymax=8,
        legend pos = north east % 修改图例位置为东北方向
    ]
        % 绘制 f(x)=2^x
        \addplot[
            domain=-3:3,
            samples=100,
            color=blue,
            thick
        ] {2^x};
        \addlegendentry{\(f(x)=2^x\)}

        % 绘制 g(x)= -x^2 + 1
        \addplot[
            domain=-3:3,
            samples=100,
            color=red,
            thick
        ] {-x^2 + 1};
        \addlegendentry{\(g(x)= -x^2 + 1\)}

        % 近似计算交点
        \pgfmathsetmacro{\intersectionX}{-0.444} % 近似交点 x 坐标
        \pgfmathsetmacro{\intersectionY}{2^\intersectionX} % 对应的 y 坐标

        % 标记交点
        \filldraw[black] (\intersectionX,\intersectionY) circle (2pt);
        \node[above right] at (\intersectionX,\intersectionY) {$\text{交点}$};
          \filldraw[black] (0,1) circle (2pt) node[anchor=north] ;
    \end{axis}
\end{tikzpicture}
\end{document}
调整后的图形: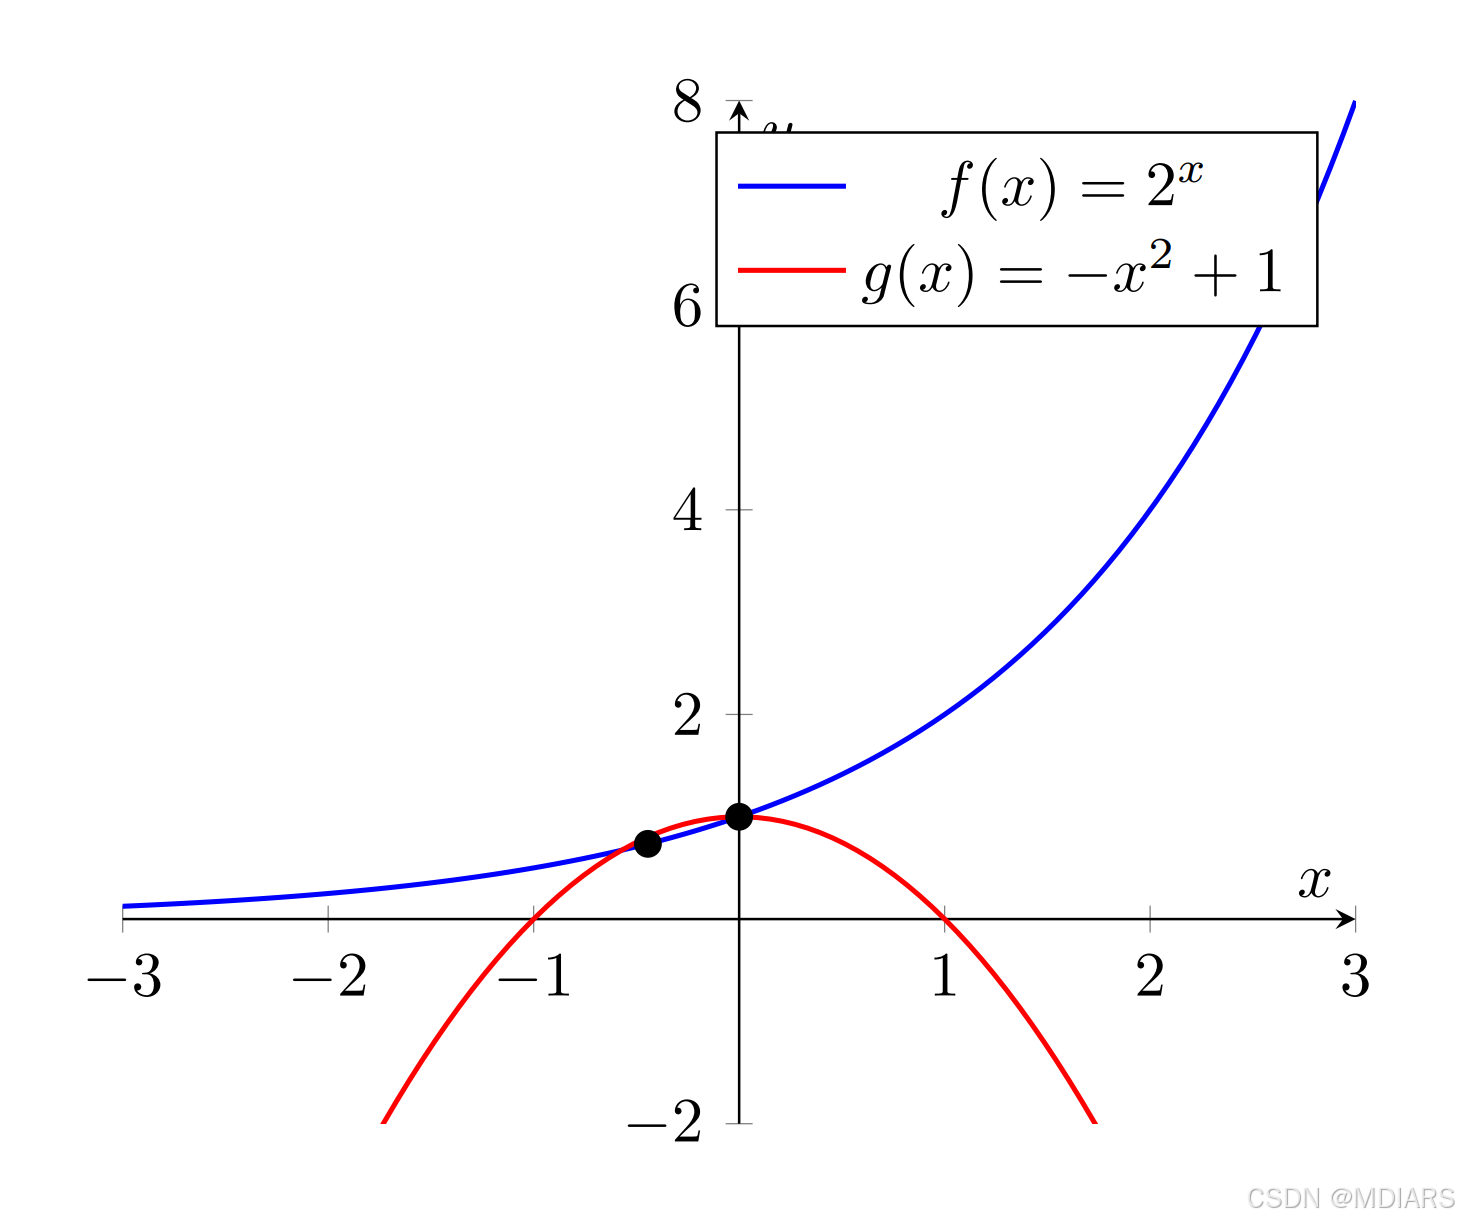
故而我们可以利用legend pos = north west(东南西北方向)来调整我们想要的图例的大体方向,方便我们后续对图例的位置做进一步调整。
我们发现上述图例位置方向改变后,图例依旧是挡住了y轴,故而就要做出更为细致的位置调整。
1.2 图例的大小调整
在 pgfplots 中,你可以通过 legend style 选项来调节图例(legend)的大小、字体、间距等样式。要调节图例的大小,可通过设置 font 来改变字体大小,进而改变图例整体大小。
以下是示例:
\documentclass[tikz,border=10pt]{standalone}
\usepackage{tikz}
\usepackage{pgfplots}
\pgfplotsset{compat=1.18}

\begin{document}
\begin{tikzpicture}
    \begin{axis}[
        axis lines = middle,
        xlabel = \(x\),
        ylabel = {\(y\)},
        xmin=-3,
        xmax=3,
        ymin=-2,
        ymax=8,
        legend pos = north east,
        legend style={
            font=\tiny % 这里可以修改字体大小,如\tiny, \scriptsize, \footnotesize, \small, \normalsize, \large, \Large, \LARGE, \huge, \Huge等
        }
    ]
        % 绘制 f(x)=2^x
        \addplot[
            domain=-3:3,
            samples=100,
            color=blue,
            thick
        ] {2^x};
        \addlegendentry{\(f(x)=2^x\)}

        % 绘制 g(x)= -x^2 + 1
        \addplot[
            domain=-3:3,
            samples=100,
            color=red,
            thick
        ] {-x^2 + 1};
        \addlegendentry{\(g(x)= -x^2 + 1\)}

        % 近似计算交点
        \pgfmathsetmacro{\intersectionX}{-0.444} % 近似交点 x 坐标
        \pgfmathsetmacro{\intersectionY}{2^\intersectionX} % 对应的 y 坐标

        % 标记交点
        \filldraw[black] (\intersectionX,\intersectionY) circle (2pt);
        \node[above right] at (\intersectionX,\intersectionY) {$\text{交点}$};
        \filldraw[black] (0,1) circle (2pt) node[anchor=north] ;
    \end{axis}
\end{tikzpicture}
\end{document}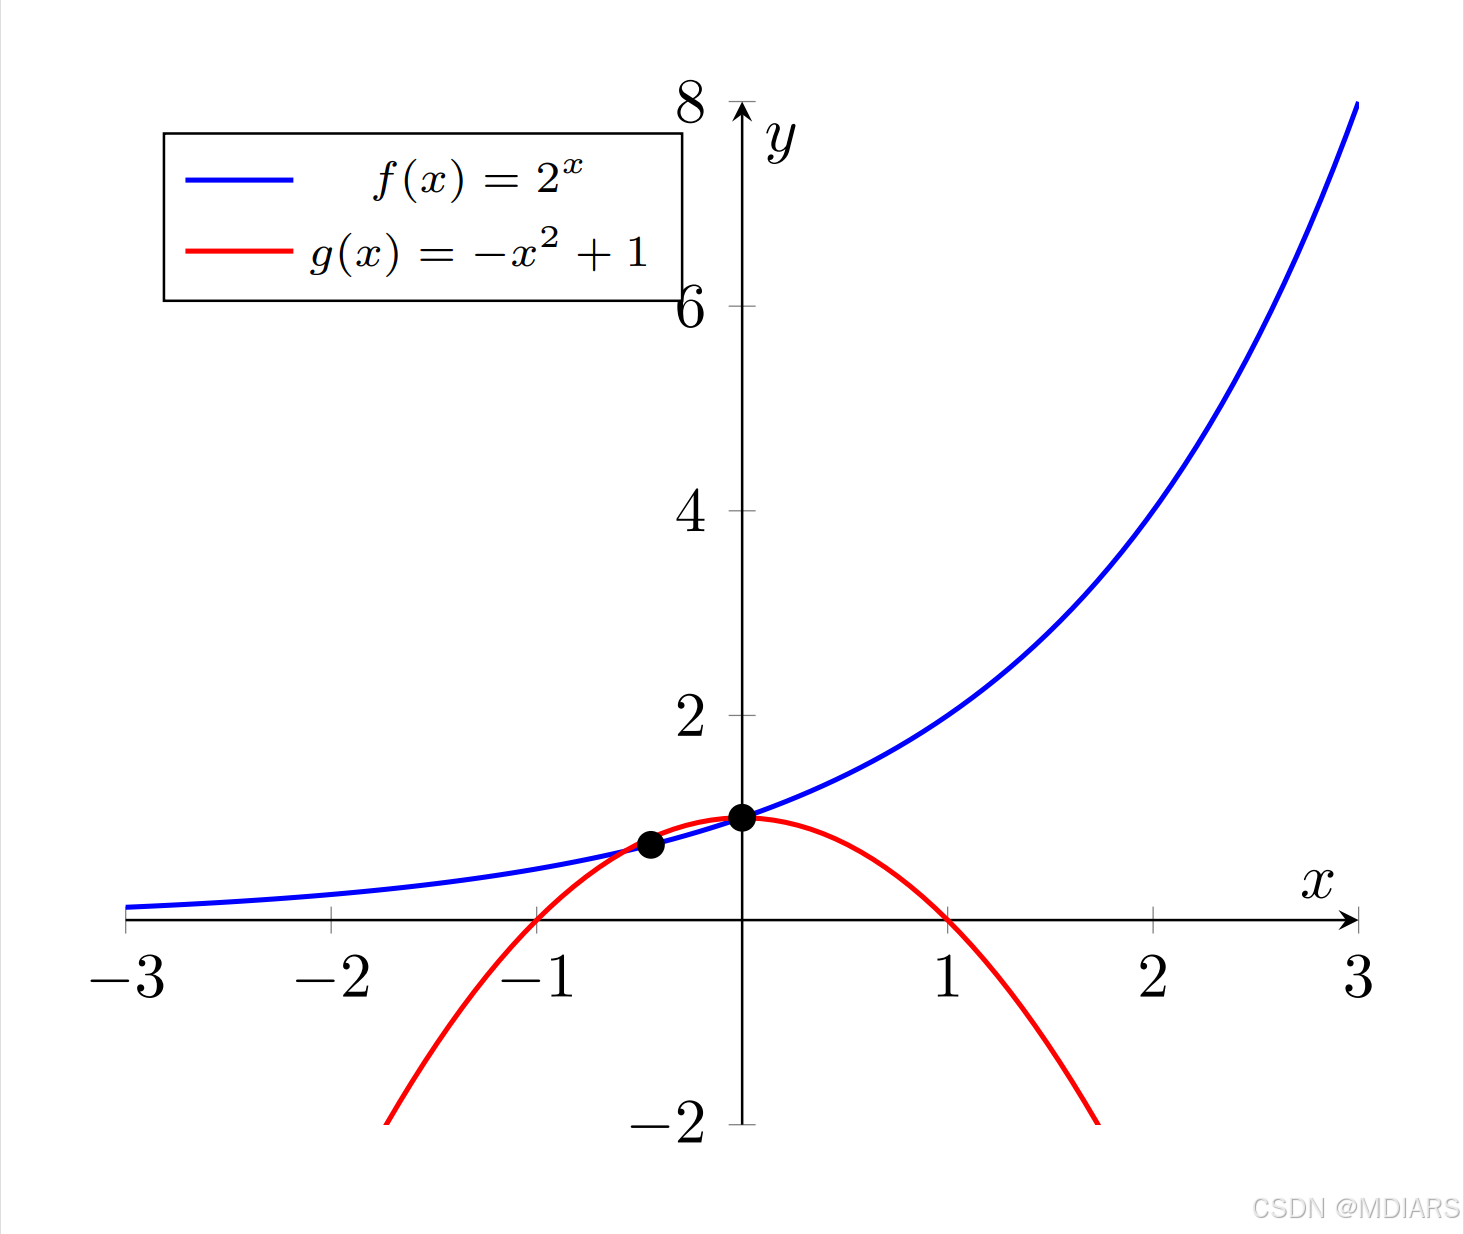
在上述代码第二段中,通过在
legend style里设置font=\tiny来减小图例字体大小,你可以根据需求将\tiny替换为其他 LaTeX 字体大小命令,如\scriptsize、\footnotesize、\small、\normalsize、\large、\Large、\LARGE、\huge、\Huge等,从而调节图例大小。
除了调节图例的字体大小间距,我们还可以对图例进行位置的移动,不用于上述的大方向的调整,是小的位置调整。
1.3 图例的位置细致调整
在
pgfplots中,除了使用legend pos来设置图例的大致位置(如north east、north west等),你还可以通过legend style里的xshift和yshift选项来对图例进行更精细的位置调整,xshift用于控制水平方向的移动,yshift用于控制垂直方向的移动。正值表示向右或向上移动,负值表示向左或向下移动。
以下是修改后的代码,展示了如何使用 xshift 和 yshift 来调整图例的位置:
\documentclass[tikz,border=10pt]{standalone}
\usepackage{tikz}
\usepackage{pgfplots}
\pgfplotsset{compat=1.18}

\begin{document}
\begin{tikzpicture}
    \begin{axis}[
        axis lines = middle,
        xlabel = \(x\),
        ylabel = {\(y\)},
        xmin=-3,
        xmax=3,
        ymin=-2,
        ymax=8,
        legend pos = north east,
        legend style={
            font=\tiny,
            xshift=-10pt, % 向左移动 10pt
            yshift=-5pt   % 向下移动 5pt
        }
    ]
        % 绘制 f(x)=2^x
        \addplot[
            domain=-3:3,
            samples=100,
            color=blue,
            thick
        ] {2^x};
        \addlegendentry{\(f(x)=2^x\)}

        % 绘制 g(x)= -x^2 + 1
        \addplot[
            domain=-3:3,
            samples=100,
            color=red,
            thick
        ] {-x^2 + 1};
        \addlegendentry{\(g(x)= -x^2 + 1\)}

        % 近似计算交点
        \pgfmathsetmacro{\intersectionX}{-0.444} % 近似交点 x 坐标
        \pgfmathsetmacro{\intersectionY}{2^\intersectionX} % 对应的 y 坐标

        % 标记交点
        \filldraw[black] (\intersectionX,\intersectionY) circle (2pt);
        \node[above right] at (\intersectionX,\intersectionY) {$\text{交点}$};
        \filldraw[black] (0,1) circle (2pt) node[anchor=north] ;
    \end{axis}
\end{tikzpicture}
\end{document}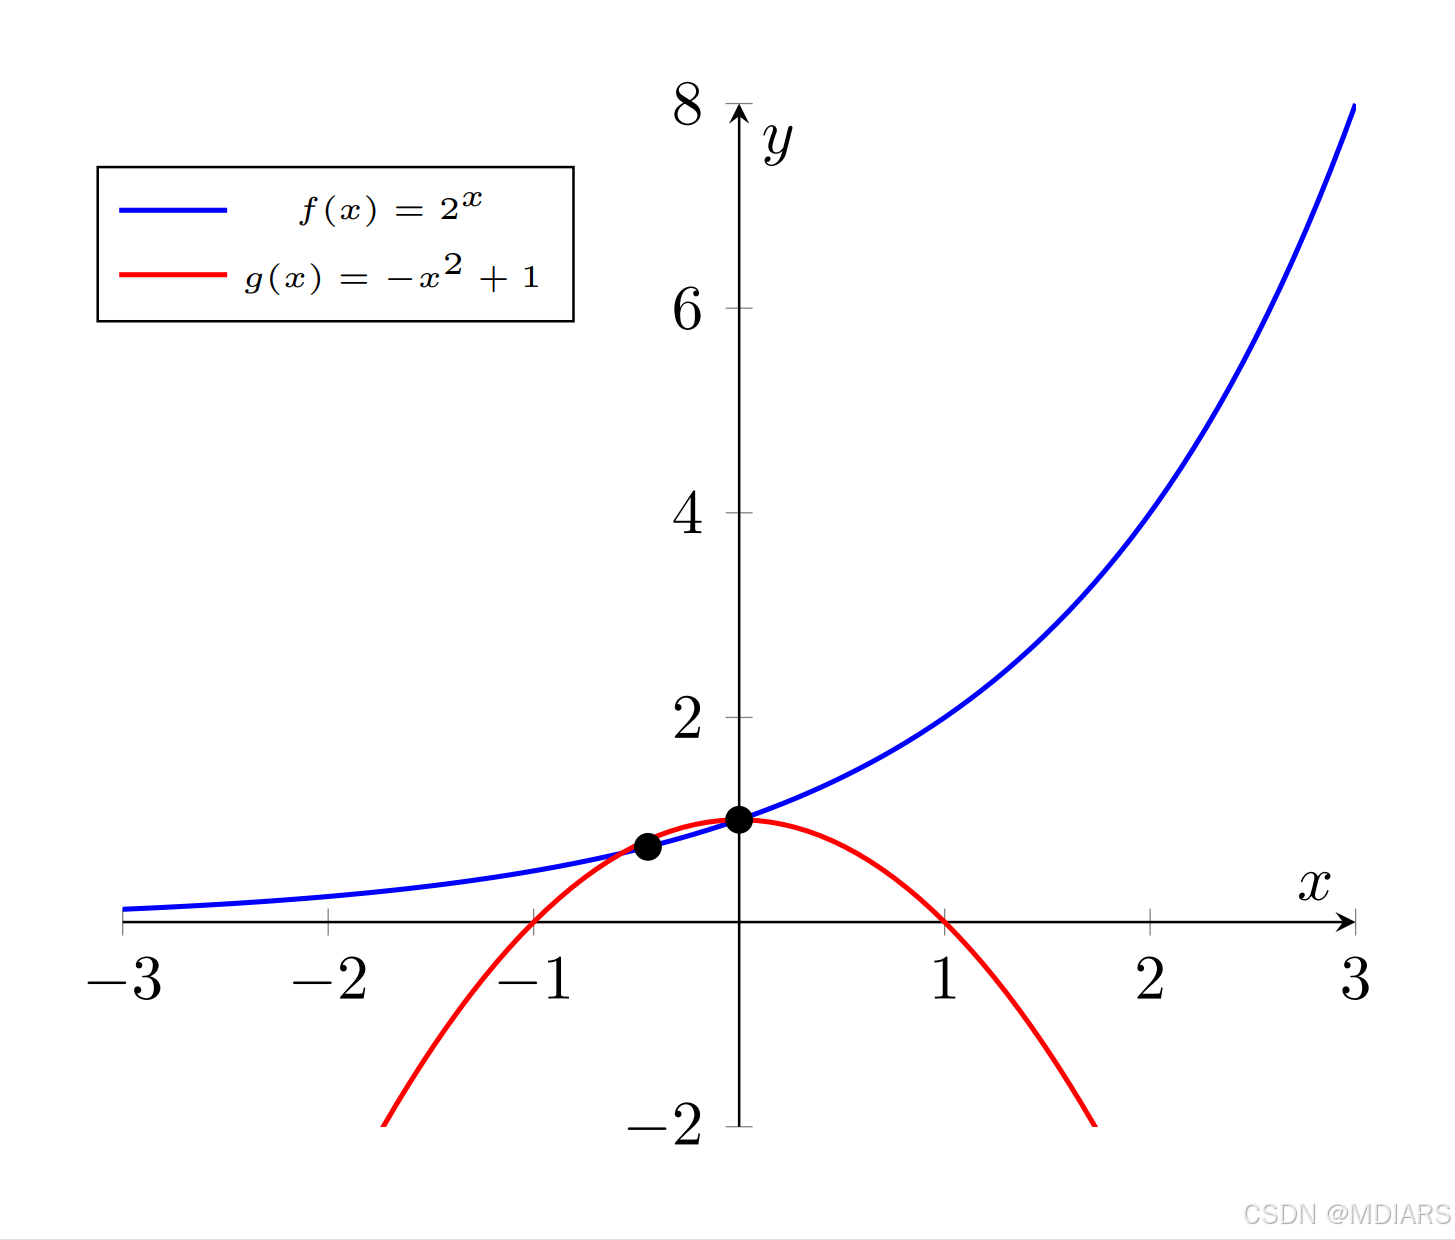
在这个代码中,
xshift=-10pt使图例向左移动了10pt,yshift=-5pt使图例向下移动了5pt。你可以根据实际需求调整xshift和yshift的值,以达到理想的位置。pt是 LaTeX 中常用的长度单位,你也可以使用其他长度单位,如cm、mm等。
二、图例的更多设置代码的扩展
在 pgfplots 中,关于图例的设置还有很多其他的选项和功能,以下是一些扩展知识:
2.1 图例的边框与背景
draw:用于设置图例的边框颜色。例如,legend style={draw=gray}将使图例边框为灰色。fill:用于设置图例的背景颜色。例如,legend style={fill=lightgray}会把图例的背景填充为浅灰色。rounded corners:可以使图例的边框角变为圆角。例如,legend style={rounded corners=5pt}将把图例的边框角设置为半径为 5pt 的圆角。
2.2 图例的布局与排列
legend columns:用于指定图例的列数。例如,legend style={legend columns=2}会将图例排列为两列。column sep:控制图例中各列之间的间距。例如,legend style={column sep=5pt}会使列间距为 5pt。legend entries left:如果设置了这个选项,图例将从左到右、从上到下排列,与默认的从右到左、从上到下排列方式相反。
2.3 图例与图形的交互
legend image post style:可以对图例中的线条或图形进行额外的样式设置。例如,如果你想让图例中的线条更粗,可以使用legend image post style={line width=1.5pt}。every axis legend:这是一个全局的pgfplots样式,用于设置所有坐标轴图例的默认样式。你可以在文档的前言部分使用\pgfplotsset{every axis legend/.style={...}}来设置所有图例的通用样式。
以下是一个综合示例代码,展示了上述部分功能:
\documentclass[tikz,border=10pt]{standalone}
\usepackage{tikz}
\usepackage{pgfplots}
\pgfplotsset{compat=1.18}

\begin{document}
\begin{tikzpicture}
    \begin{axis}[
        axis lines = middle,
        xlabel = \(x\),
        ylabel = {\(y\)},
        xmin=-3,
        xmax=3,
        ymin=-2,
        ymax=8,
        legend pos = north east,
        legend style={
            font=\tiny,
            xshift=-10pt,
            yshift=-5pt,
            draw=gray,
            fill=lightgray,
            rounded corners=5pt,
            legend columns=2,
            column sep=5pt,
            legend image post style={line width=1.5pt}
        }
    ]
        % 绘制 f(x)=2^x
        \addplot[
            domain=-3:3,
            samples=100,
            color=blue,
            thick
        ] {2^x};
        \addlegendentry{\(f(x)=2^x\)}

        % 绘制 g(x)= -x^2 + 1
        \addplot[
            domain=-3:3,
            samples=100,
            color=red,
            thick
        ] {-x^2 + 1};
        \addlegendentry{\(g(x)= -x^2 + 1\)}

        % 近似计算交点
        \pgfmathsetmacro{\intersectionX}{-0.444} % 近似交点 x 坐标
        \pgfmathsetmacro{\intersectionY}{2^\intersectionX} % 对应的 y 坐标

        % 标记交点
        \filldraw[black] (\intersectionX,\intersectionY) circle (2pt);
        \node[above right] at (\intersectionX,\intersectionY) {$\text{交点}$};
        \filldraw[black] (0,1) circle (2pt) node[anchor=north] ;
    \end{axis}
\end{tikzpicture}
\end{document}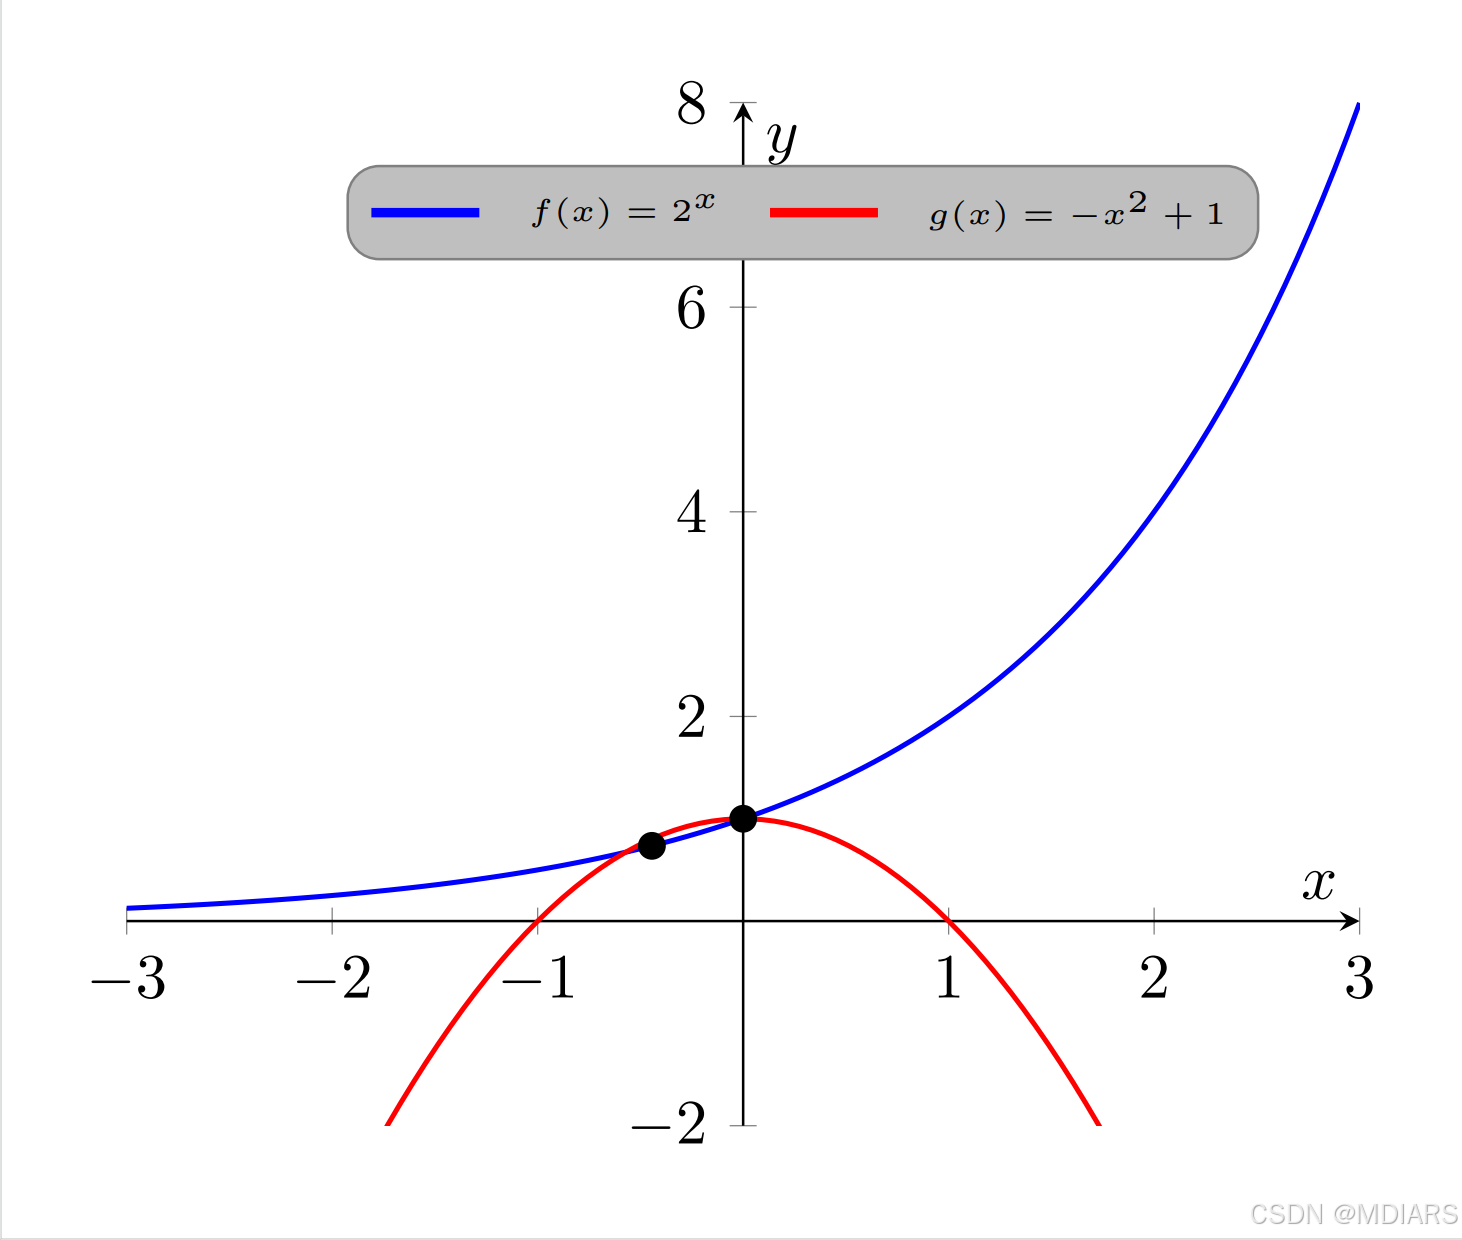


 3万+
3万+

 被折叠的 条评论
为什么被折叠?
被折叠的 条评论
为什么被折叠?
 到【灌水乐园】发言


