


echart官网
echart图表渲染
先下包
npm install echarts在页面中导入import * as echarts from 'echarts'
![]()
用useRef绑定dom元素(div盒子)

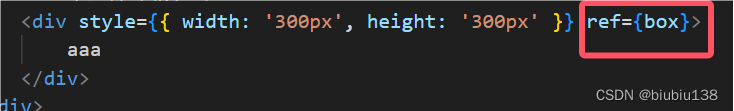
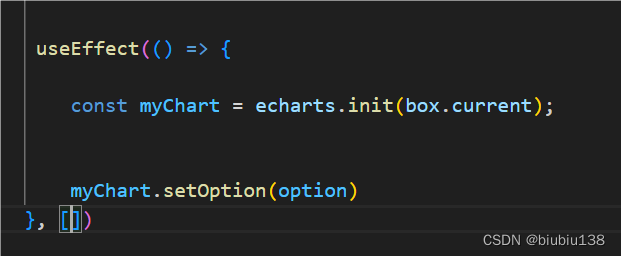
在useEffect里渲染图标
useEffect(()=>{
const mychart=echarts.init (useRef绑定的元素)
let option={表格数据}
mychart.setOption(option)
},[])
连接后台数据渲染图表
在后台模拟数据
router.post('/list',ctx=>{
    let data=Mock.mock({
        'list':[
            {
                legend:{data:['哈哈哈','嘻嘻','嘿嘿','哦哦','过过']},
                "series":[
                    {
                        data:[Mock.mock('@integer(1,109)'),Mock.mock('@integer(1,90)'),Mock.mock('@integer(1,100)'),Mock.mock('@integer(1,100)'),Mock.mock('@integer(1,100)')]
                    },
                    {
                        data:[Mock.mock('@integer(1,109)'),Mock.mock('@integer(1,90)'),Mock.mock('@integer(1,100)'),Mock.mock('@integer(1,100)'),Mock.mock('@integer(1,100)')]
                    },
                    {
                        data:[Mock.mock('@integer(1,109)'),Mock.mock('@integer(1,90)'),Mock.mock('@integer(1,100)'),Mock.mock('@integer(1,100)'),Mock.mock('@integer(1,100)')]
                    },
                    {
                        data:[Mock.mock('@integer(1,109)'),Mock.mock('@integer(1,90)'),Mock.mock('@integer(1,100)'),Mock.mock('@integer(1,100)'),Mock.mock('@integer(1,100)')]
                    },
                    {
                        data:[Mock.mock('@integer(1,109)'),Mock.mock('@integer(1,90)'),Mock.mock('@integer(1,100)'),Mock.mock('@integer(1,100)'),Mock.mock('@integer(1,100)')]
                    },
                ]
            }
        ]
    })

    ctx.body={
        data:data.list
    }
})
或者调用后台接口
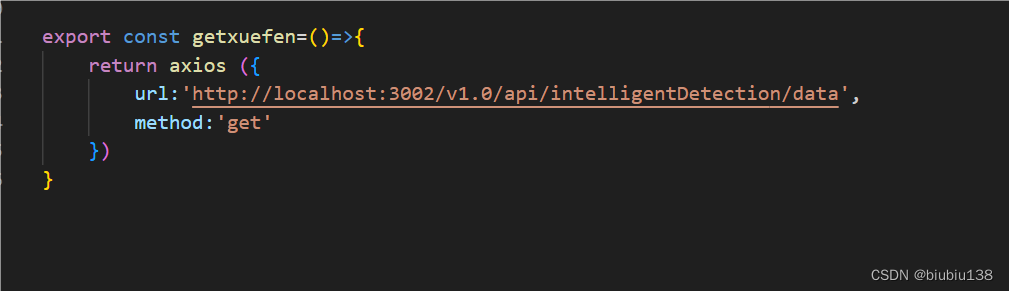
在 页面中调用接口
在useEffect中调用接口
并在接口中重新渲染option中的内容
给option定义数据状态
const [option, setoption] = useState({

      title: {
        text: '标题文本'
    },
    // 鼠标放到图表上出现的弹出框提示框
    tooltip: {
        trigger: 'axis'
    },
    // 设置图例项
    // legend: {
    //     data: ['Email', 'Union Ads', 'Video Ads', 'Direct', 'Search Engine']
    // },
    // 修饰图表在整个标签上的位置
    grid: {
        left: '30%',
        right: '4%',
        bottom: '3%',
        containLabel: true
    },
    // 工具箱:包含下载图表的图标
    // toolbox: {
    //     feature: {
    //         saveAsImage: {}
    //     }
    // },
    // 配置x轴内容
    xAxis: {
        type: 'category',
        boundaryGap: false,
        data: ['Mon', 'Tue', 'Wed', 'Thu', 'Fri', 'Sat', 'Sun']
    },
    // y轴内容
    yAxis: {
        // type: 'value'
    },
    // 图表中的主要数据
    series: [
        {
            // 图例项中的名称
            name: 'Email',
            // 图表类型
            type: 'line',
            stack: 'Total',
            data: [120, 132, 101, 134, 90, 230, 210]
        },
        {
            name: 'Union Ads',
            type: 'line',
            stack: 'Total',
            data: [220, 182, 191, 234, 290, 330, 310]
        },
        {
            name: 'Video Ads',
            type: 'line',
            stack: 'Total',
            data: [150, 232, 201, 154, 190, 330, 410]
        },
        {
            name: 'Direct',
            type: 'line',
            stack: 'Total',
            data: [320, 332, 301, 334, 390, 330, 320]
        },
        {
            name: 'Search Engine',
            type: 'line',
            stack: 'Total',
            data: [820, 932, 901, 934, 1290, 1330, 1320]
        }
    ]
    });
useEffect(() => {
// 获取dom元素
const myChart = echarts.init(box.current);
list().then(res => {
console.log(res.data.data)
// 后台接口数据替换option中的图例数据
option.legend.data = res.data.data[0].legend.data
console.log(option.legend.data, 1111)
// 后台接口数据替换option中的series数据
option.series=res.data.data[0].series.map(item=>{
return {
// name: item.name,
type: 'line',
stack: 'Total',
data: item.data,
symbol: 'none',
smooth: true
}
})
// 修改后的数据存入setoption
setoption(option)
// 使用刚指定的配置项和数据显示图表。 重选渲染图表
myChart.setOption(option)
})
}, [])
柱状图圆弧 柱子粗细改变和柱子颜色渐变
series: [
{
type: 'bar',
itemStyle: {
// 柱子颜色渐变
color: new echarts.graphic.LinearGradient(0, 0, 0, 1, [
{ offset: 0, color: '#2a37ff' },
{ offset: 0.5, color: '#711cff' },
{ offset: 1, color: '#b205ff' }]),
// 圆弧
barBorderRadius: 15,
},
// 柱子粗细
barWidth: '15%',
},
{
type: 'bar',
itemStyle: {
// 柱子颜色 单色
color: '#38da84',
barBorderRadius: 15,
},
barWidth: '15%',
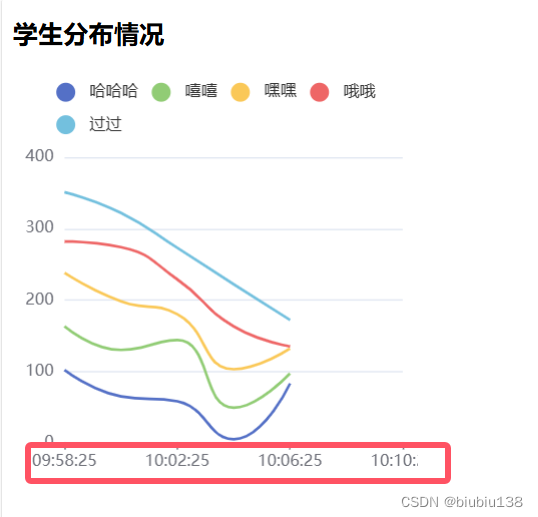
}]dayjs时间
下包
> npm install dayjs导入 import dayjs from 'dayjs'
先定义一个空数组
let arr=[]
获取当前时间
let now=+now Date
循环所需要数据的长度 例如:需要四个数据
for(let a=0;a<4;a++){
将循环的数添加在空数组arr中
arr.push(dayjs(now).format('HH:mm:ss'))
每个数据加两分钟
now-=2*60*1000
}
用arr 代替option数据中的轴数据


 8861
8861

 被折叠的 条评论
为什么被折叠?
被折叠的 条评论
为什么被折叠?
 到【灌水乐园】发言


