


tstem.m
function tstem(xn,yn)
%时域序列绘图函数

% xn:信号数据序列,yn:绘图信号的纵坐标名称(字符串)
n=0:length(xn)-1;
stem(n,xn,'filled');box on
xlabel('n');ylabel(yn);
axis([0,n(end),-1.2*abs(min(xn)),1.2*abs(max(xn))])mstem.m
function mstem(Xk)
% mstem(Xk)绘制频域采样序列向量Xk的幅频特性图

M=length(Xk);
k=0:M-1;wk=2*k/M;                     %产生M点DFT对应的采样点频率(关于π归一化值)
stem(wk,abs(Xk),'filled');box on      %绘制M点DFT的幅频特性图
xlabel('ω/π');ylabel('幅度');
axis([0,2,0,1.2*max(abs(Xk))])
实验三:用FFT对信号做频谱分析
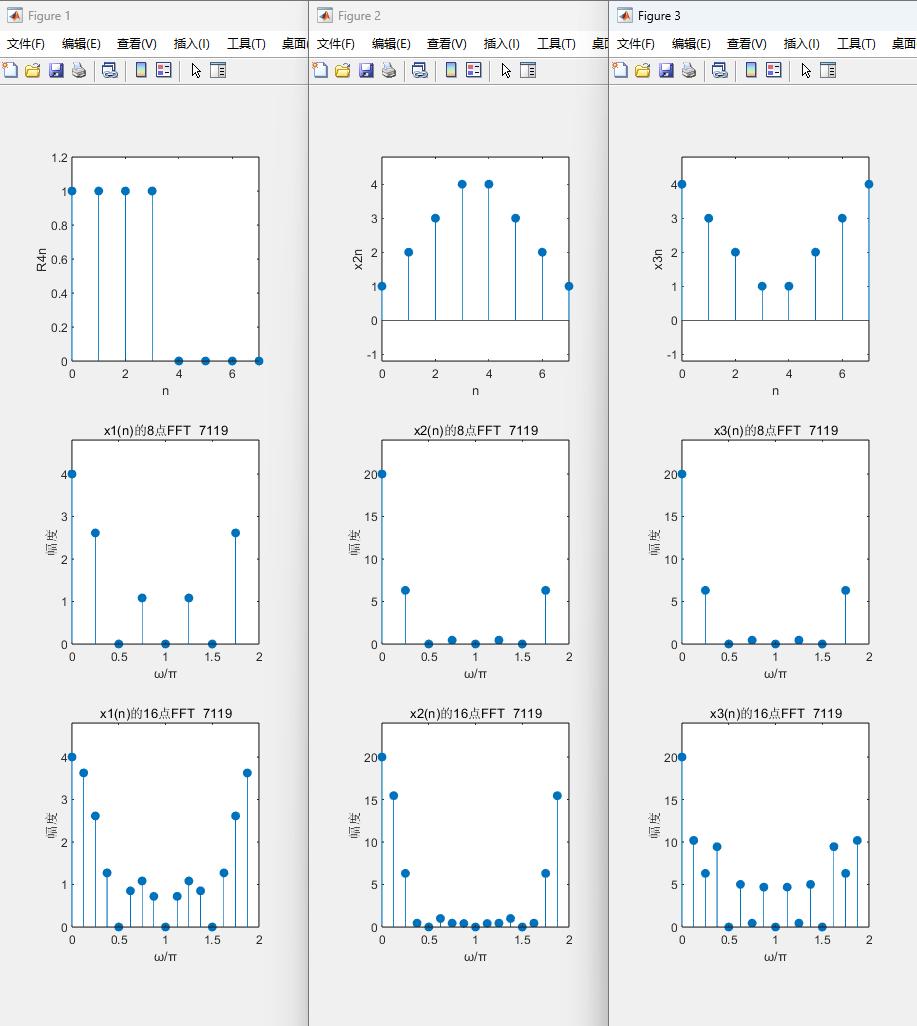
(1)
实验参考程序
%% x1n 相关图像
x1n = [ones(1,4),zeros(1,4)];
figure;
subplot(3,2,1);
tstem(x1n,'R4n');

Xk = fft(x1n,8);
subplot(3,2,3);
mstem(Xk);
title("x1(n)的8点FFT  7119");

Xk = fft(x1n,16);
subplot(3,2,5);
mstem(Xk);
title("x1(n)的16点FFT  7119");

%% x2n 相关图像
x2n = [(1:1:4),(4:-1:1)];
figure;
subplot(3,2,1);
tstem(x2n,'x2n');

Xk = fft(x2n,8);
subplot(3,2,3);
mstem(Xk);
title("x2(n)的8点FFT  7119");

Xk = fft(x2n,16);
subplot(3,2,5);
mstem(Xk);
title("x2(n)的16点FFT  7119");

%% x3n 相关图像
x3n = [(4:-1:1),(1:1:4)];
figure;
subplot(3,2,1);
tstem(x3n,'x3n');

Xk = fft(x3n,8);
subplot(3,2,3);
mstem(Xk);
title("x3(n)的8点FFT  7119");

Xk = fft(x3n,16);
subplot(3,2,5);
mstem(Xk);
title("x3(n)的16点FFT  7119");
运行结果
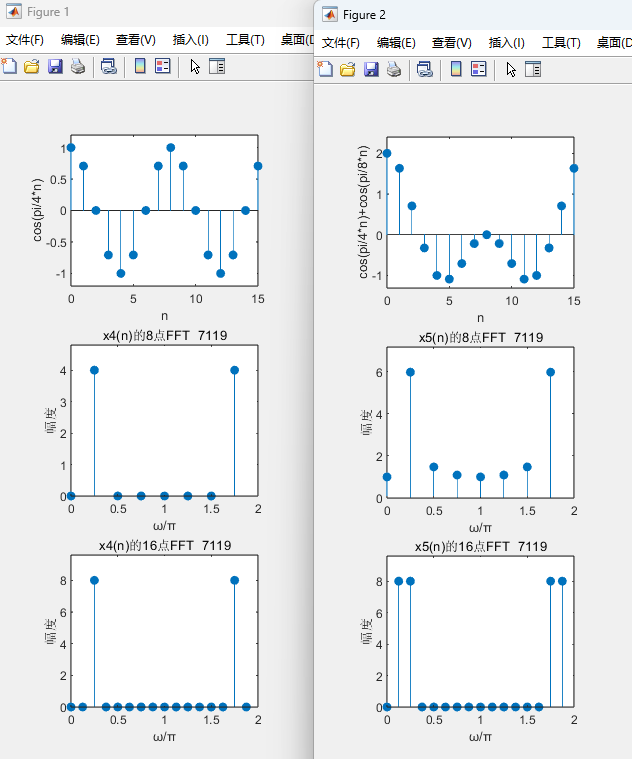
(2)
实验参考程序
%% x4n 相关图像
n=0:15;
x4n=cos(pi/4.*n);
figure;
subplot(3,2,1);
tstem(x4n,'cos(pi/4*n)');

subplot(3,2,3);
Xk=fft(x4n,8);
mstem(Xk);
title('x4(n)的8点FFT  7119');

subplot(3,2,5);
Xk=fft(x4n,16);
mstem(Xk);
title('x4(n)的16点FFT  7119');

%% x5n 相关图像
n=0:15;
x5n=cos(pi/4.*n)+cos(pi/8.*n);
figure;
subplot(3,2,1);
tstem(x5n,'cos(pi/4*n)+cos(pi/8*n)');

subplot(3,2,3);
Xk=fft(x5n,8);
mstem(Xk);
title('x5(n)的8点FFT  7119');

subplot(3,2,5);
Xk=fft(x5n,16);
mstem(Xk);
title('x5(n)的16点FFT  7119');
运行结果
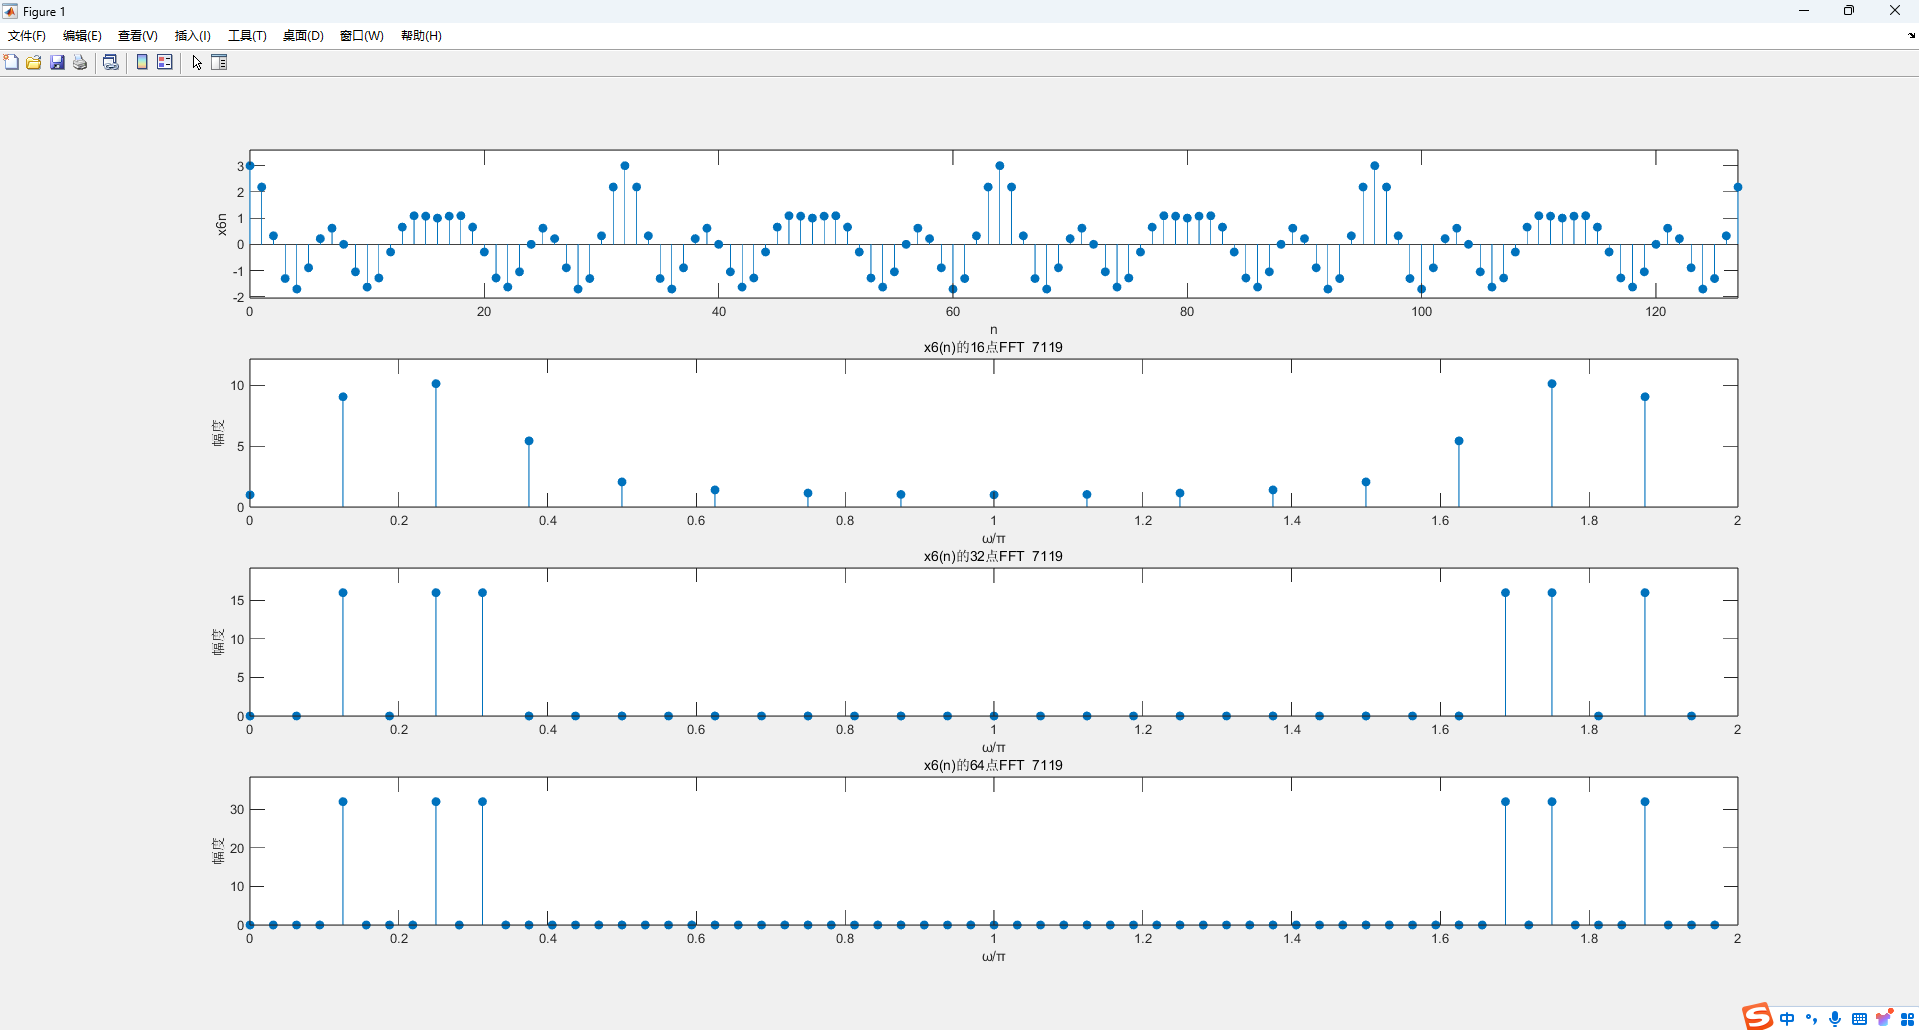
(3)
实验参考程序
Fs=64;
T=1/Fs;
N=128;
n=0:N-1;
x6t=cos(8*pi.*n*T) + cos(16*pi.*n*T) + cos(20*pi.*n*T);
subplot(4,1,1);
tstem(x6t,'x6n');
%% x6n 16fft 相关图像
N=16;
n=0:N-1;
x6t=cos(8*pi.*n*T) + cos(16*pi.*n*T) + cos(20*pi.*n*T);
Xk=fft(x6t,16);
subplot(4,1,2);
mstem(Xk);
title('x6(n)的16点FFT  7119');
%% x6n 32fft 相关图像
N=32;
n=0:N-1;
x6t=cos(8*pi.*n*T) + cos(16*pi.*n*T) + cos(20*pi.*n*T);
Xk=fft(x6t,32);
subplot(4,1,3);
mstem(Xk);
title('x6(n)的32点FFT  7119');

%% x6n 64fft 相关图像
N=64;
n=0:N-1;
x6t=cos(8*pi.*n*T) + cos(16*pi.*n*T) + cos(20*pi.*n*T);
Xk=fft(x6t,64);
subplot(4,1,4);
mstem(Xk);
title('x6(n)的64点FFT  7119');
运行结果


 被折叠的 条评论
为什么被折叠?
被折叠的 条评论
为什么被折叠?
 到【灌水乐园】发言


