


-d, --delay <n>       number of seconds to delay between refreshes
-D, --dump-symtab     dump the symbol table used for profiling
-E, --entries <n>     display this many functions
-e, --event <event>   event selector. use 'perf list' to list available events
-f, --count-filter <n>
                      only display functions with more events than this
-F, --freq <freq or 'max'>
                      profile at this frequency
-g                    enables call-graph recording and display
-i, --no-inherit      child tasks do not inherit counters
-j, --branch-filter <branch filter mask>
                      branch stack filter modes
-K, --hide_kernel_symbols
                      hide kernel symbols
-k, --vmlinux <file>  vmlinux pathname
-M, --disassembler-style <disassembler style>
                      Specify disassembler style (e.g. -M intel for intel syntax)
-m, --mmap-pages <pages>
                      number of mmap data pages
-n, --show-nr-samples
                      Show a column with the number of samples
-p, --pid <pid>       profile events on existing process id
-r, --realtime <n>    collect data with this RT SCHED_FIFO priority
-s, --sort <key[,key2...]>
                      sort by key(s): pid, comm, dso, symbol, parent, cpu, srcline, ... Please refer the man page for the complete list.
-t, --tid <tid>       profile events on existing thread id
-U, --hide_user_symbols
                      hide user symbols
-u, --uid <user>      user to profile
-v, --verbose         be more verbose (show counter open errors, etc)
-w, --column-widths <width[,width...]>
                      don't try to adjust column width, use these fixed values
-z, --zero            zero history across updates
    --asm-raw         Display raw encoding of assembly instructions (default)
    --call-graph <record_mode[,record_size],print_type,threshold[,print_limit],order,sort_key[,branch]>
                      setup and enables call-graph (stack chain/backtrace):

                            record_mode:    call graph recording mode (fp|dwarf|lbr)
                            record_size:    if record_mode is 'dwarf', max size of stack recording (<bytes>)
                                            default: 8192 (bytes)
                            print_type:     call graph printing style (graph|flat|fractal|folded|none)
                            threshold:      minimum call graph inclusion threshold (<percent>)
                            print_limit:    maximum number of call graph entry (<number>)
                            order:          call graph order (caller|callee)
                            sort_key:       call graph sort key (function|address)
                            branch:         include last branch info to call graph (branch)
                            value:          call graph value (percent|period|count)

                            Default: fp,graph,0.5,caller,function
    --children        Accumulate callchains of children and show total overhead as well
    --comms <comm[,comm...]>
                      only consider symbols in these comms
    --demangle-kernel
                      Enable kernel symbol demangling
    --dsos <dso[,dso...]>
                      only consider symbols in these dsos
    --fields <key[,keys...]>
                      output field(s): overhead, period, sample plus all of sort keys
    --force           don't complain, do it
    --group           put the counters into a counter group
    --hierarchy       Show entries in a hierarchy
    --ignore-callees <regex>
                      ignore callees of these functions in call graphs
    --ignore-vmlinux  don't load vmlinux even if found
    --max-stack <n>   Set the maximum stack depth when parsing the callchain. Default: kernel.perf_event_max_stack or 127
    --num-thread-synthesize <n>
                      number of thread to run event synthesize
    --objdump <path>  objdump binary to use for disassembly and annotations
    --overwrite       Use a backward ring buffer, default: no
    --percent-limit <percent>
                      Don't show entries under that percent
    --percentage <relative|absolute>
                      How to display percentage of filtered entries
    --proc-map-timeout <n>
                      per thread proc mmap processing timeout in ms
    --raw-trace       Show raw trace event output (do not use print fmt or plugins)
    --show-total-period
                      Show a column with the sum of periods
    --source          Interleave source code with assembly code (default)
    --stdio           Use the stdio interface
    --sym-annotate <symbol name>
                      symbol to annotate
    --symbols <symbol[,symbol...]>
                      only consider these symbols
    --tui             Use the TUI interface
[root@centos7 ~]# perf top -a
Samples: 646K of event ‘cpu-clock’, 4000 Hz, Event count (approx.): 12702138322 lost: 0/0 drop: 0/0
Overhead Shared Object Symbol
29.70% php-fpm [.] 0x00000000006250c2
Samples:采集cpu时钟事件的总样本数, 可以在命令中跟上 -e 事件 参数来指定跟踪的事件,perf list 命令,列出所有可跟踪的事件。
Event count:事件总数量
Overhead:符号引起的性能事件在总采样本中的百分比
Shared Object :符号所在的DSO(Dynamic Shared Object),一般是应用程序、内核、动态连接库、模块
[.]表示此符号属于用户态的ELF文件,包括可执行文件与动态连接库;[k]表述此符号属于内核或模块。
Symbol:符号名或函数名,未知时,用十六进制显示
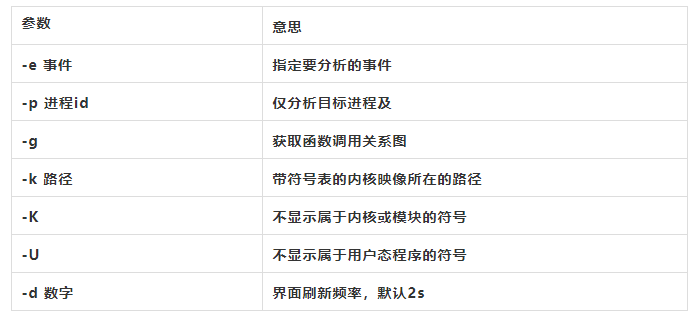
perf top 常用的扩展参数有
[root@centos7 ~]# perf list
List of pre-defined events (to be used in -e):
alignment-faults [Software event]
bpf-output [Software event]
context-switches OR cs [Software event]
cpu-clock [Software event]
cpu-migrations OR migrations [Software event]
dummy [Software event]
emulation-faults [Software event]
major-faults [Software event]
minor-faults [Software event]
page-faults OR faults [Software event]
task-clock [Software event]
msr/tsc/ [Kernel PMU event]
rNNN [Raw hardware event descriptor]
cpu/t1=v1[,t2=v2,t3 …]/modifier [Raw hardware event descriptor]
(see ‘man perf-list’ on how to encode it)
mem:[/len][:access] [Hardware breakpoint]
block:block_bio_backmerge [Tracepoint event]
block:block_bio_bounce [Tracepoint event]
block:block_bio_complete [Tracepoint event]
block:block_bio_frontmerge [Tracepoint event]
Software 是软件事件


Hardware\cache\Kernel PMU 都是硬件事件


Tracepoint是基于内核的ftrace
指定跟踪的事件 perf top -e block:block_rq_issue Samples: 11 of event ‘block:block_rq_issue’, 1 Hz, Event count (approx.): 1 lost: 0/0 drop: 1/8 Overhead
100.00%
14.29% 0,0 R 8 (4a 01 00 00 10 00 00 00 08 00) 0 + 0 [kworker/1:0]
跟踪某个进程的事件情况
[root@centos7 ~]# perf top -p 2087
Samples: 2K of event ‘cpu-clock’, 4000 Hz, Event count (approx.): 520562500 lost: 0/0 drop: 0/0
Overhead Shared Object Symbol
29.87% php-fpm [.] 0x00000000006250c2
### `►►► 具体跟踪某一个进程`
perf record -g p pid
[root@centos7 ~]# perf record -g -p 2181
收集一段较长时间后,ctrl+c 停止
执行命令之后,会在当前路径下生成一个 perf.data文件


### `►►► 分析perf.data文件`


在有perf.data文件的路径下,执行 perf report
[root@centos7 ~]# perf report
Samples: 142K of event ‘cpu-clock’, Event count (approx.): 35597750000, Thread: php-fpm
Children Self Command Shared Object Symbol
- 31.44% 0.00% php-fpm php-fpm [.] 0x000056149fda70c2 ◆
- 30.78% 30.78% php-fpm php-fpm [.] 0x00000000006250c2
看到里面的+号的行,可以回车,逐级往下定位


### `►►► 查看某个进程在一段时间内`


### 调用CPU情况 perf stat
perf stat -p 进程id
执行一段时间后,ctrl+c停止
[root@centos7 ~]# perf stat -p 2399
^C
Performance counter stats for process id ‘2399’:
     93,774.02 msec task-clock                #    0.399 CPUs utilized
        21,295      context-switches          #    0.227 K/sec
           541      cpu-migrations            #    0.006 K/sec
             0      page-faults               #    0.000 K/sec
cycles
instructions
branches
最后的话
最近很多小伙伴找我要Linux学习资料,于是我翻箱倒柜,整理了一些优质资源,涵盖视频、电子书、PPT等共享给大家!
资料预览
给大家整理的视频资料:

给大家整理的电子书资料:
如果本文对你有帮助,欢迎点赞、收藏、转发给朋友,让我有持续创作的动力!
网上学习资料一大堆,但如果学到的知识不成体系,遇到问题时只是浅尝辄止,不再深入研究,那么很难做到真正的技术提升。
一个人可以走的很快,但一群人才能走的更远!不论你是正从事IT行业的老鸟或是对IT行业感兴趣的新人,都欢迎加入我们的的圈子(技术交流、学习资源、职场吐槽、大厂内推、面试辅导),让我们一起学习成长!
发给朋友,让我有持续创作的动力!**
网上学习资料一大堆,但如果学到的知识不成体系,遇到问题时只是浅尝辄止,不再深入研究,那么很难做到真正的技术提升。
一个人可以走的很快,但一群人才能走的更远!不论你是正从事IT行业的老鸟或是对IT行业感兴趣的新人,都欢迎加入我们的的圈子(技术交流、学习资源、职场吐槽、大厂内推、面试辅导),让我们一起学习成长!


 186
186

 被折叠的 条评论
为什么被折叠?
被折叠的 条评论
为什么被折叠?
 到【灌水乐园】发言


