


既有适合小白学习的零基础资料,也有适合3年以上经验的小伙伴深入学习提升的进阶课程,涵盖了95%以上大数据知识点,真正体系化!
由于文件比较多,这里只是将部分目录截图出来,全套包含大厂面经、学习笔记、源码讲义、实战项目、大纲路线、讲解视频,并且后续会持续更新
city STRING
);
– 插入数据到etl_weather_data表
INSERT INTO TABLE etl_weather_data
SELECT
SUBSTR(date, 1, INSTR(date, ’ ') - 1) AS date,
SUBSTR(date, INSTR(date, ’ ') + 1) AS day_of_week,
CAST(SUBSTR(high_temperature, 1, INSTR(high_temperature, ‘°’) - 1) AS INT) AS high_temperature,
CAST(SUBSTR(low_temperature, 1, INSTR(low_temperature, ‘°’) - 1) AS INT) AS low_temperature,
weather,
REGEXP_REPLACE(SUBSTR(wind_direction, 1, INSTR(wind_direction, ‘级’) - 1), ‘[0-9]’, ‘’) AS wind_direction,
SUBSTR(SUBSTR(wind_direction, INSTR(wind_direction, ‘风’) + 1),1,1) AS wind_speed,
city
FROM
weather_data;
– 1.统计一年中每个城市晴天个数的top10
CREATE TABLE IF NOT EXISTS top_sunny_cities (
city STRING,
sunny_days_count INT
);
INSERT INTO TABLE top_sunny_cities
SELECT
city,
COUNT(*) AS sunny_days_count
FROM
etl_weather_data
WHERE
weather LIKE ‘%晴%’
GROUP BY
city
ORDER BY
sunny_days_count DESC
LIMIT 10;
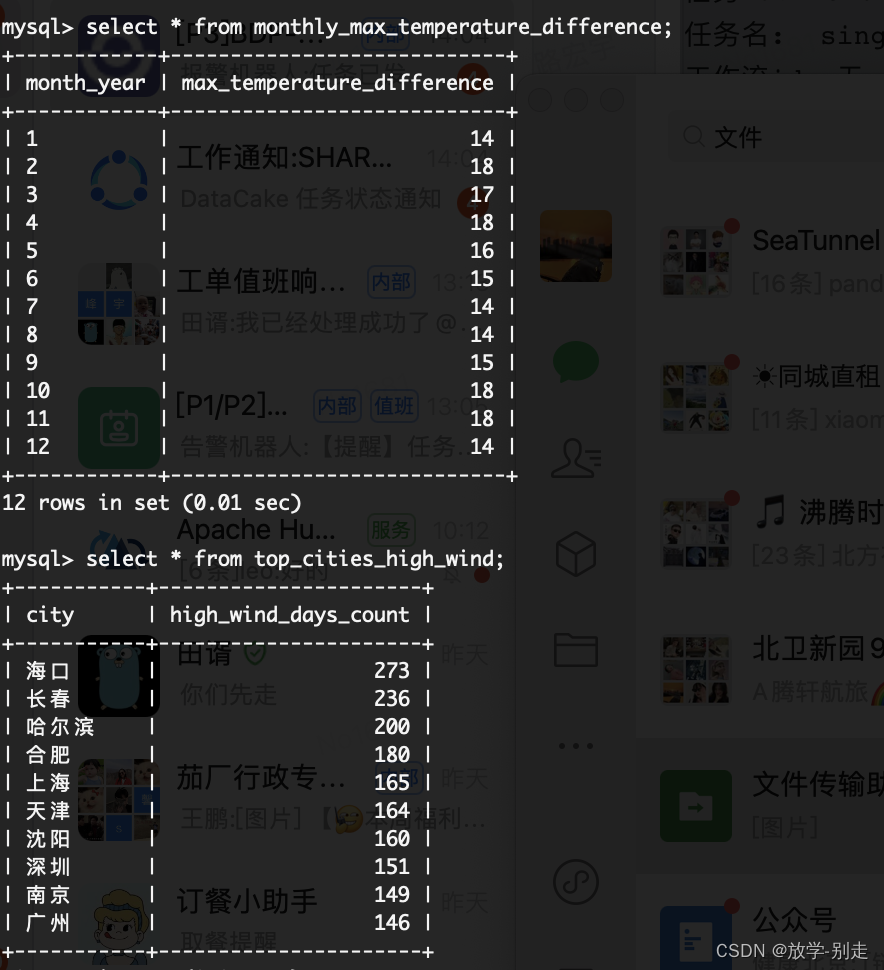
– 2.统计北京一年中每个月的温差变化
CREATE TABLE IF NOT EXISTS monthly_max_temperature_difference (
month_year STRING,
max_temperature_difference INT
);
INSERT INTO TABLE monthly_max_temperature_difference
SELECT
CONCAT(YEAR(date), ‘-’, LPAD(MONTH(date), 2, ‘0’)) AS month_year,
MAX(high_temperature - low_temperature) AS max_temperature_difference
FROM
etl_weather_data
WHERE
city = ‘北京’
GROUP BY
YEAR(date), MONTH(date);
– 3.统计城市出现3级以上风速最多的10个城市
CREATE TABLE IF NOT EXISTS top_cities_high_wind (
city STRING,
high_wind_days_count INT
);
INSERT INTO TABLE top_cities_high_wind
SELECT
city,
COUNT(*) AS high_wind_days_count
FROM
etl_weather_data
WHERE
CAST(wind_speed AS INT) >= 3
GROUP BY
city
ORDER BY
high_wind_days_count DESC
LIMIT 10;
**基于sqoop将数据导入到mysql中**
sqoop export
–connect jdbc:mysql://192.168.138.1:3306/big_data
–username root --password ‘123456’
–table top_sunny_cities_sqoop
–export-dir /hive/warehouse/big_data.db/big_data.dbbig_data.db/top_sunny_cities
–input-fields-terminated-by ‘\001’
–input-lines-terminated-by ‘\n’;
sqoop export
–connect jdbc:mysql:// 192.168.138.1:3306/big_data
–username root --password 123456
–table monthly_max_temperature_difference
–export-dir /user/hive/warehouse/big_data.db/big_data.dbmonthly_max_temperature_difference
–input-fields-terminated-by ‘\001’
–input-lines-terminated-by ‘\n’
sqoop export
–connect jdbc:mysql:// 192.168.138.1:3306/big_data
–username root --password 123456
–table top_cities_high_wind
–export-dir /user/hive/warehouse/big_data.db/big_data.dbtop_cities_high_wind
–input-fields-terminated-by ‘\001’
–input-lines-terminated-by ‘\n’
**基于mysql数据使用Django做数据可视化**
from django.contrib.auth.decorators import login_required
from django.http import HttpResponse
from django.shortcuts import render, redirect
from django.shortcuts import render
from pyecharts import options as opts
from pyecharts.charts import Line, Bar, Pie, Grid
Create your views here.
from django.shortcuts import render
from pyecharts.globals import ThemeType
from api.service.task_service import get_user, top_sunny_cities, monthly_max_temperature_difference,
top_cities_high_wind, top_rainy_cities, monthly_rainy_days, yearly_min_temperatures, daily_wind_speed,
daily_temperature_difference, register_user
def login_page(request):
if request.method == ‘POST’:
username = request.POST.get(‘username’)
password = request.POST.get(‘password’)
user = get_user(username,password)
if user is not None:
return redirect(‘home’)
else:
return render(request, ‘login.html’, {‘error_message’: ‘Invalid login credentials.’})
return render(request, 'login.html')
def register_view(request):
# 处理注册逻辑
if request.method == ‘GET’:
username = request.GET.get(‘username’)
password = request.GET.get(‘password’)
if username and password:
register_user(username,password)
return HttpResponse(“注册成功!”)
return render(request, ‘register.html’) # 使用你的注册模板路径
def home(request):
print(2)
return render(request, ‘home.html’)
def data_analysis(request, button_id):
return render(request, ‘data_analysis.html’, {‘button_id’: button_id})
def data_analysis(request, button_id):
# 根据按钮 ID 进行不同的处理
if button_id == 1:
    x,y = top\_sunny\_cities()
    line_chart = (
        Line()
        .add\_xaxis(xaxis_data=x)
        .add\_yaxis(series_name="晴天个数", y_axis=y)
        .set\_global\_opts(title_opts=opts.TitleOpts(title="一年中每个城市晴天个数的top10"))
    )
    chart_html = line_chart.render\_embed()
    button_name = "折线图"
elif button_id == 2:
    x,y = monthly\_max\_temperature\_difference()
    line_chart = (
        Line()
        .add\_xaxis(xaxis_data=x)
        .add\_yaxis(series_name="温差值", y_axis=y)
        .set\_global\_opts(title_opts=opts.TitleOpts(title="北京一年中每个月的温差变化"))
    )
    chart_html = line_chart.render\_embed()
    button_name = "折线图"
elif button_id == 3:
    x,y = top\_cities\_high\_wind()
    bar_chart = (
        Bar()
        .add\_xaxis(xaxis_data=x)
        .add\_yaxis(series_name="3级风速次数",y_axis=y)
        .set\_global\_opts(title_opts=opts.TitleOpts(title="出现3级以上风速的top10个城市"))
    )
    chart_html = bar_chart.render\_embed()
    button_name = "条形图"
elif button_id == 4:
    x, y = top\_rainy\_cities()
    bar_chart = (
        Bar()
        .add\_xaxis(xaxis_data=x)


既有适合小白学习的零基础资料,也有适合3年以上经验的小伙伴深入学习提升的进阶课程,涵盖了95%以上大数据知识点,真正体系化!
由于文件比较多,这里只是将部分目录截图出来,全套包含大厂面经、学习笔记、源码讲义、实战项目、大纲路线、讲解视频,并且后续会持续更新
习的零基础资料,也有适合3年以上经验的小伙伴深入学习提升的进阶课程,涵盖了95%以上大数据知识点,真正体系化!**
由于文件比较多,这里只是将部分目录截图出来,全套包含大厂面经、学习笔记、源码讲义、实战项目、大纲路线、讲解视频,并且后续会持续更新


 315
315


 被折叠的 条评论
为什么被折叠?
被折叠的 条评论
为什么被折叠?
 到【灌水乐园】发言


