


The job name is added as a label job=<job\_name> to any timeseries scraped from this config.
-
job_name: ‘prometheus’
metrics_path defaults to ‘/metrics’
scheme defaults to ‘http’.
static_configs:
- targets: [‘localhost:9090’]
远程查询段
remote_read:
prometheus
- url: http://prometheus/v1/read
read_recent: true
m3db
- url: “http://m3coordinator-read:7201/api/v1/prom/remote/read”
read_recent: true
远程写入段
remote_write:
- url: “http://m3coordinator-write:7201/api/v1/prom/remote/write”
queue_config:
capacity: 10000
max_samples_per_send: 60000
write_relabel_configs:
## 二、部署prometheus监控平台


* 安装部署prometheus服务监控端
* 监控一个远端机器
* 监控一个服务:mysql
prometheus 主程序包:wget https://github.com/prometheus/prometheus/releases/download/v2.11.1/prometheus-2.16.0.linux-amd64.tar.gz
远端主机监控插件(类似于zabbix-agent): wget https://github.com/prometheus/node_exporter/releases/download/v0.18.1/node_exporter-1.0.0-rc.0linux-amd64.tar.gz
mysql业务监控插件: wget https://github.com/prometheus/mysqld_exporter/releases/download/v0.12.0/mysqld_exporter-0.12.1.linux-amd64.tar.gz
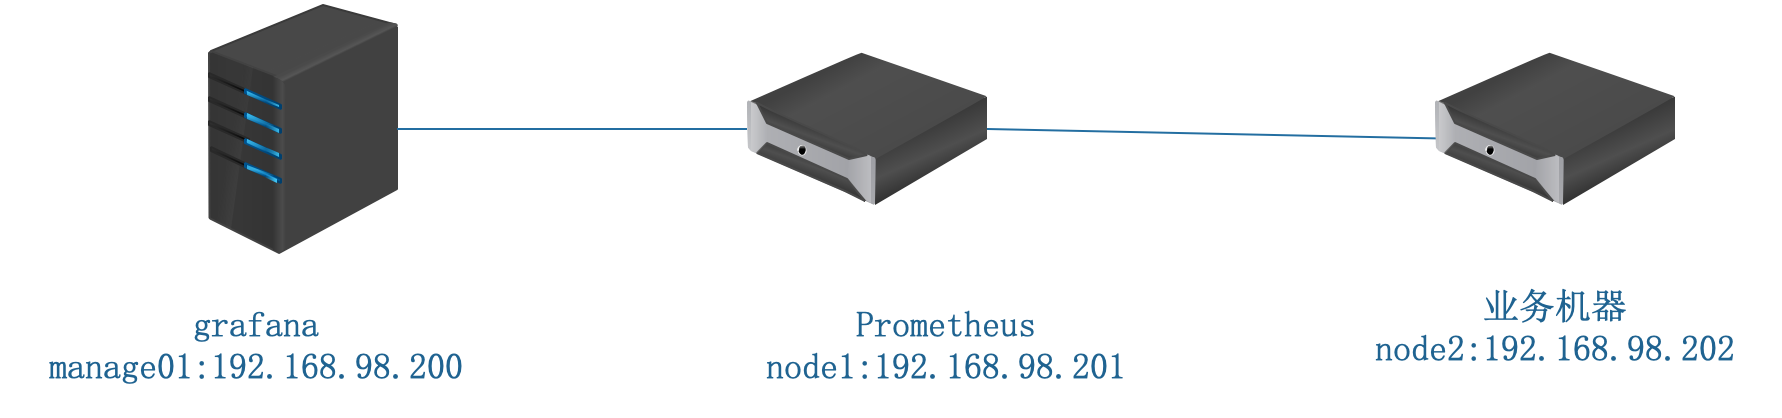
* 实验拓扑图
### 2.1、部署prometheus服务监控端
[root@node1 ~]# tar xf prometheus-2.11.1.linux-amd64.tar.gz -C /usr/local/
[root@node1 ~]# cd /usr/local/prometheus-2.11.1.linux-amd64/
[root@node1 prometheus-2.11.1.linux-amd64]# ./prometheus --config.file=prometheus.yml &
启动测试
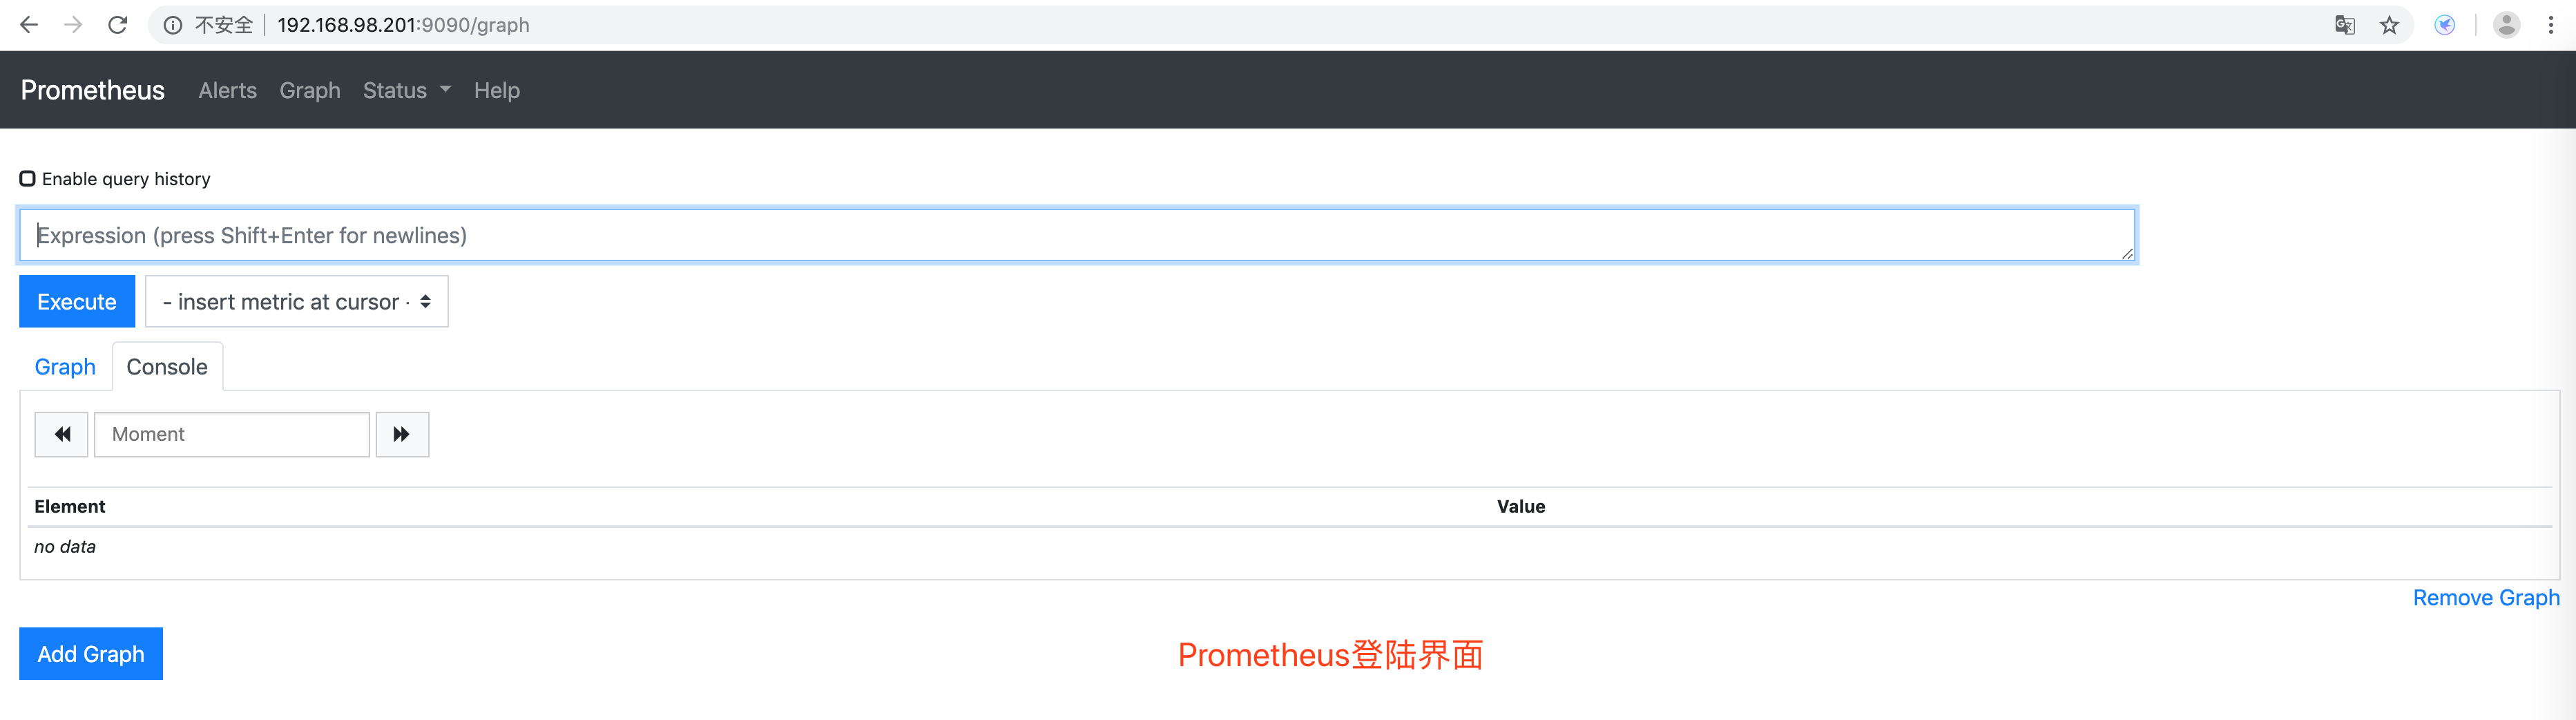
看到这个页面说明prometheus启动成功了,默认监控了自己,我们来看一下本机的监控状态
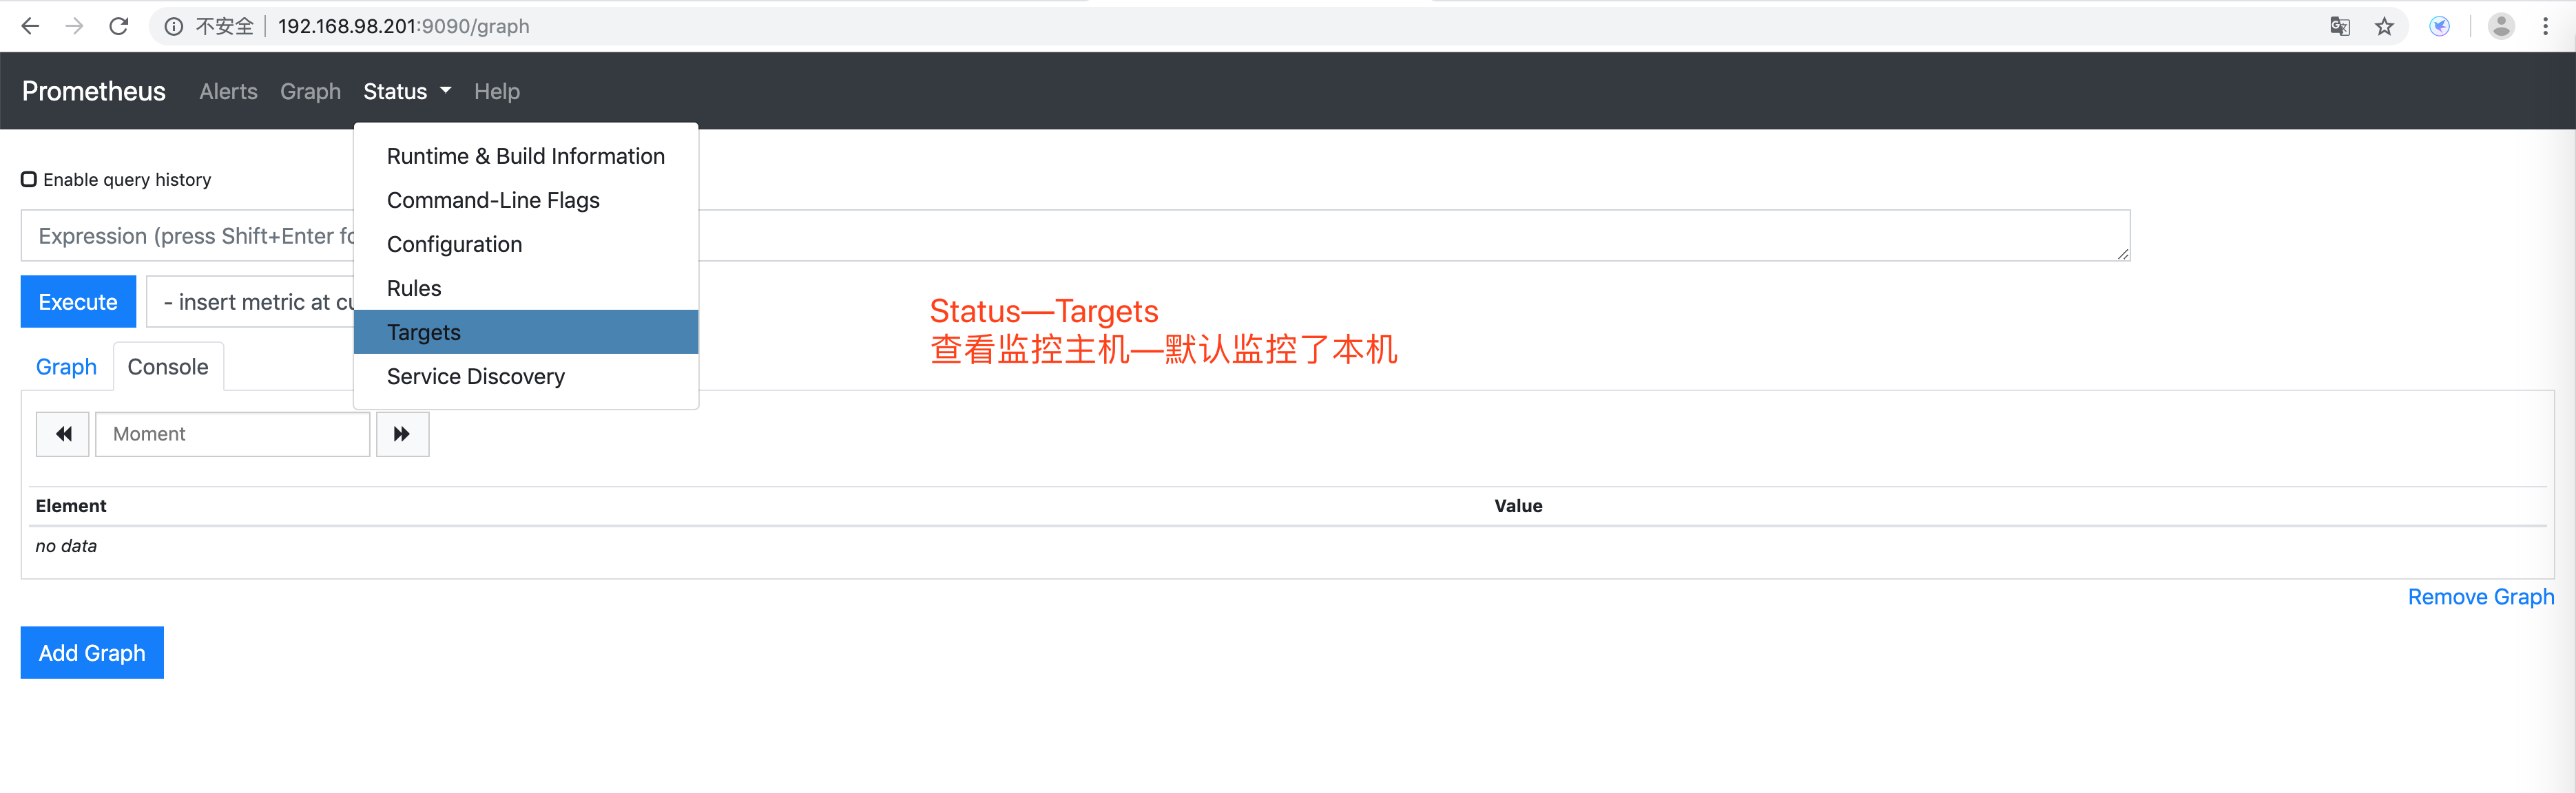
点击 status—targets即可看到监控的机器或者资源
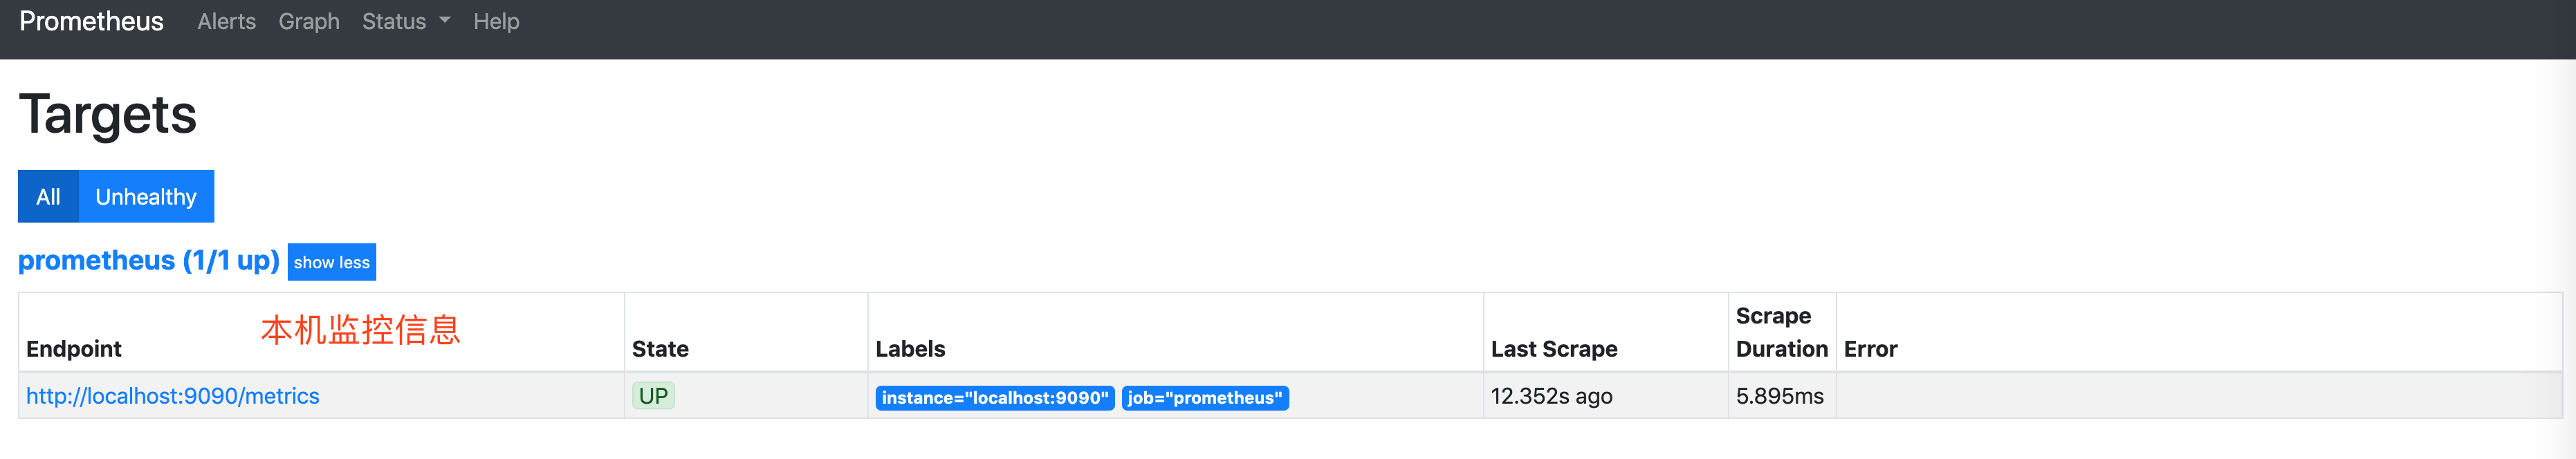
看到本机了,同时也可以根据提示在浏览器中输入http://IP或者域名:9090/metrics查看监控数据。
显示监控数据
http://192.168.98.201:9090/metrics
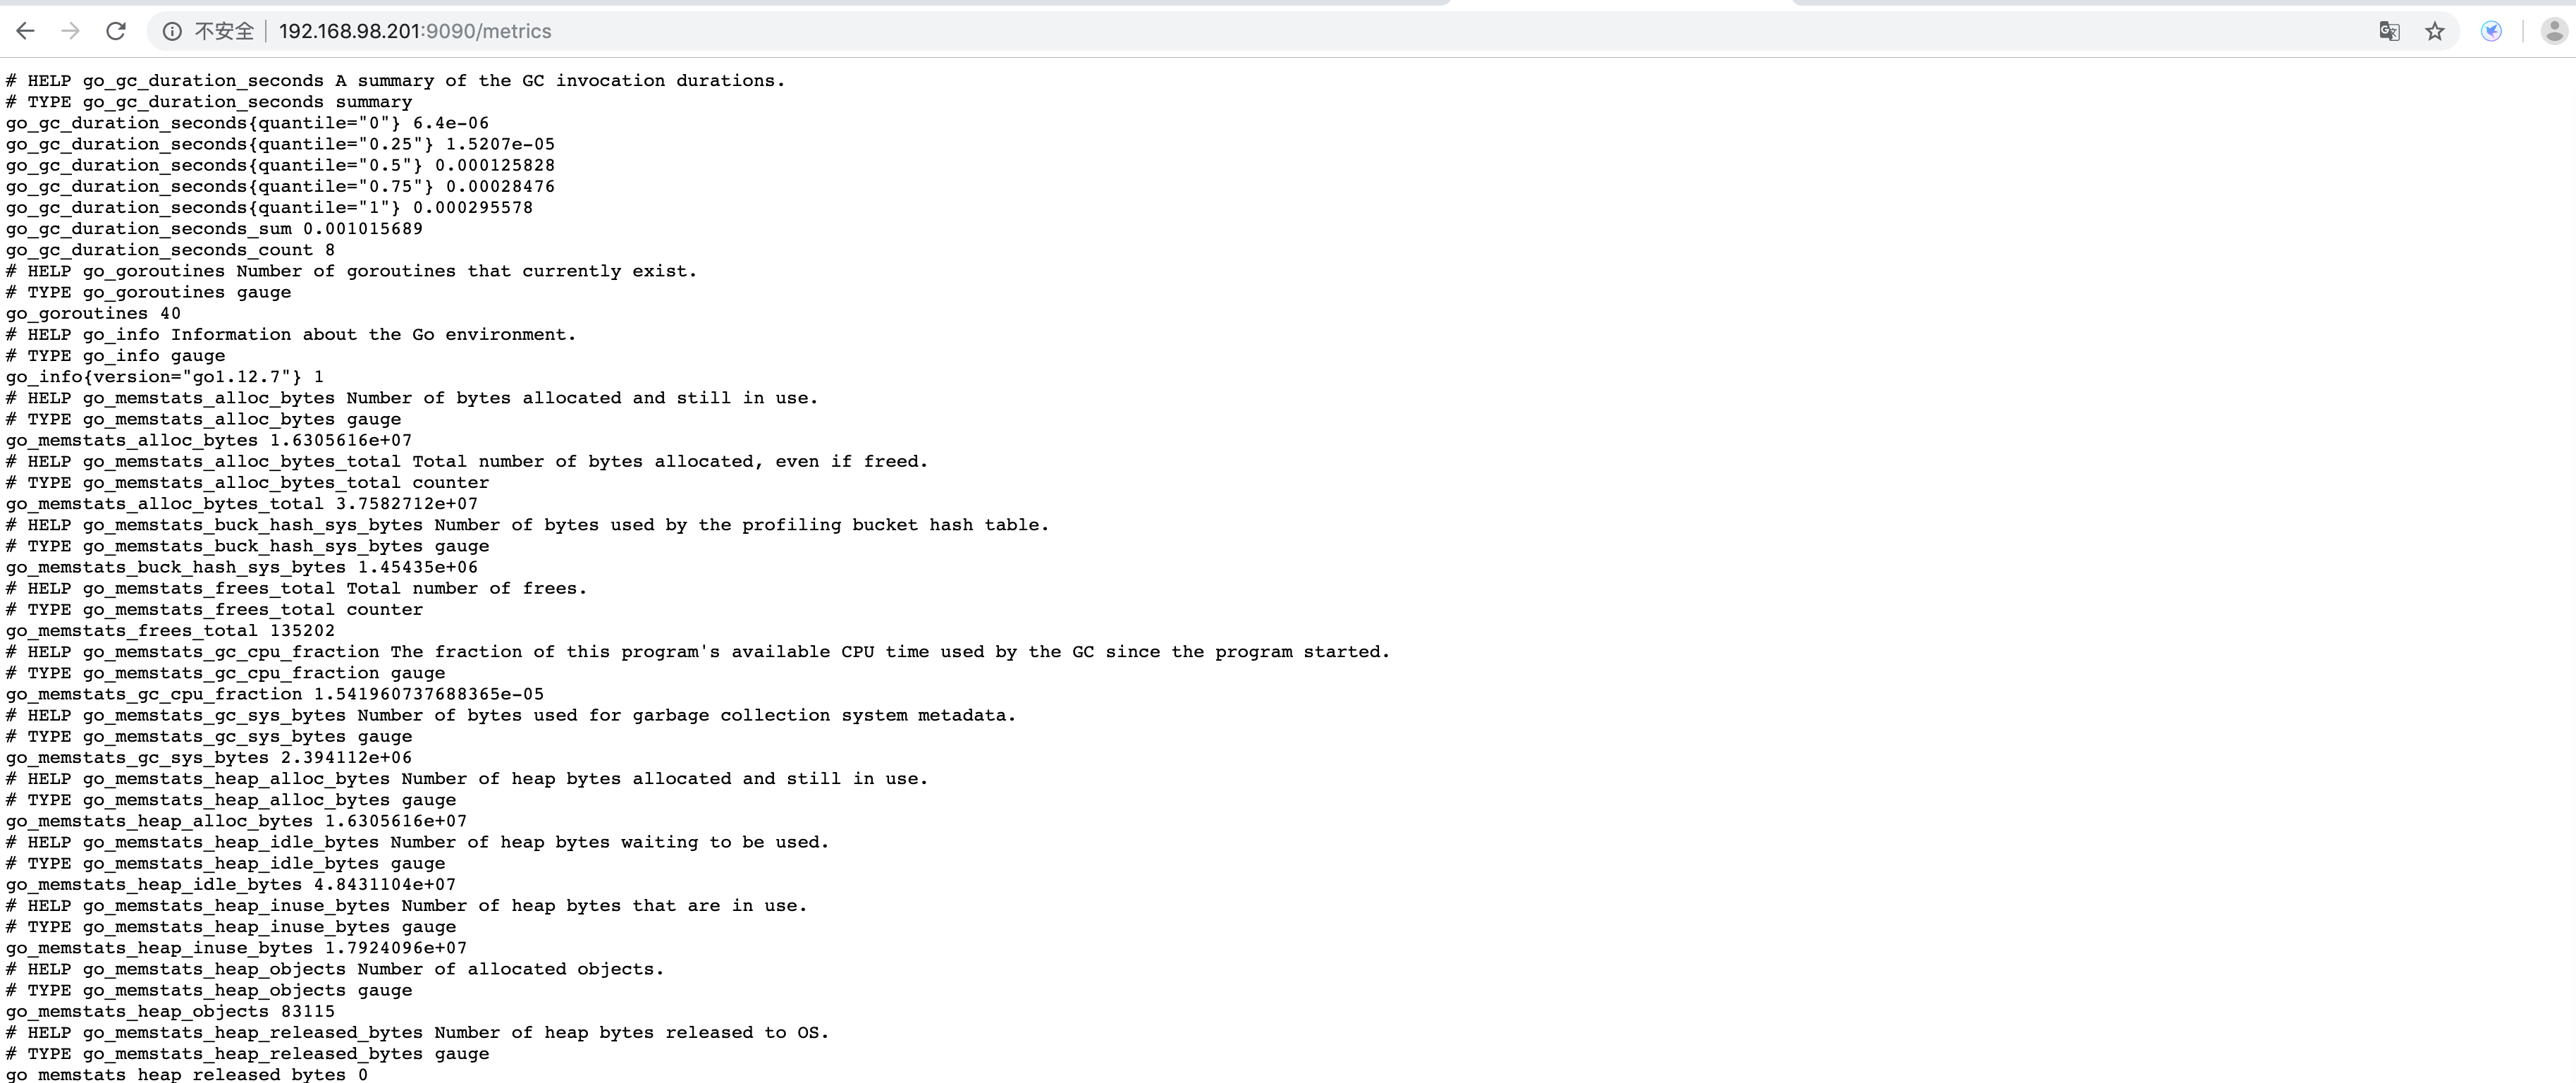
如果能看到这些信息就说明监控拿到了数据,拿到数据就可以正常显示了。通过这个URL我们可以知道prometheus把监控的数据都统一存放在一起,然后生成一个web页面,用户可以通过web页面查看相关的数据,这些数据遵循了时序数据库的格式,也就是key=value的形式.这些数据就是我们的监控指标,只不过现在还没有办法分析,需要借助图形展示才会更方便阅读
prometheus显示同样也提供了图表,可以通过图表很直观的看到监控项的状态,只不过自带的图形实在是不怎么好看。
通过点击Graph可以显示到下列图表,在搜索栏中输入关键字可以匹配出你想看的监控项
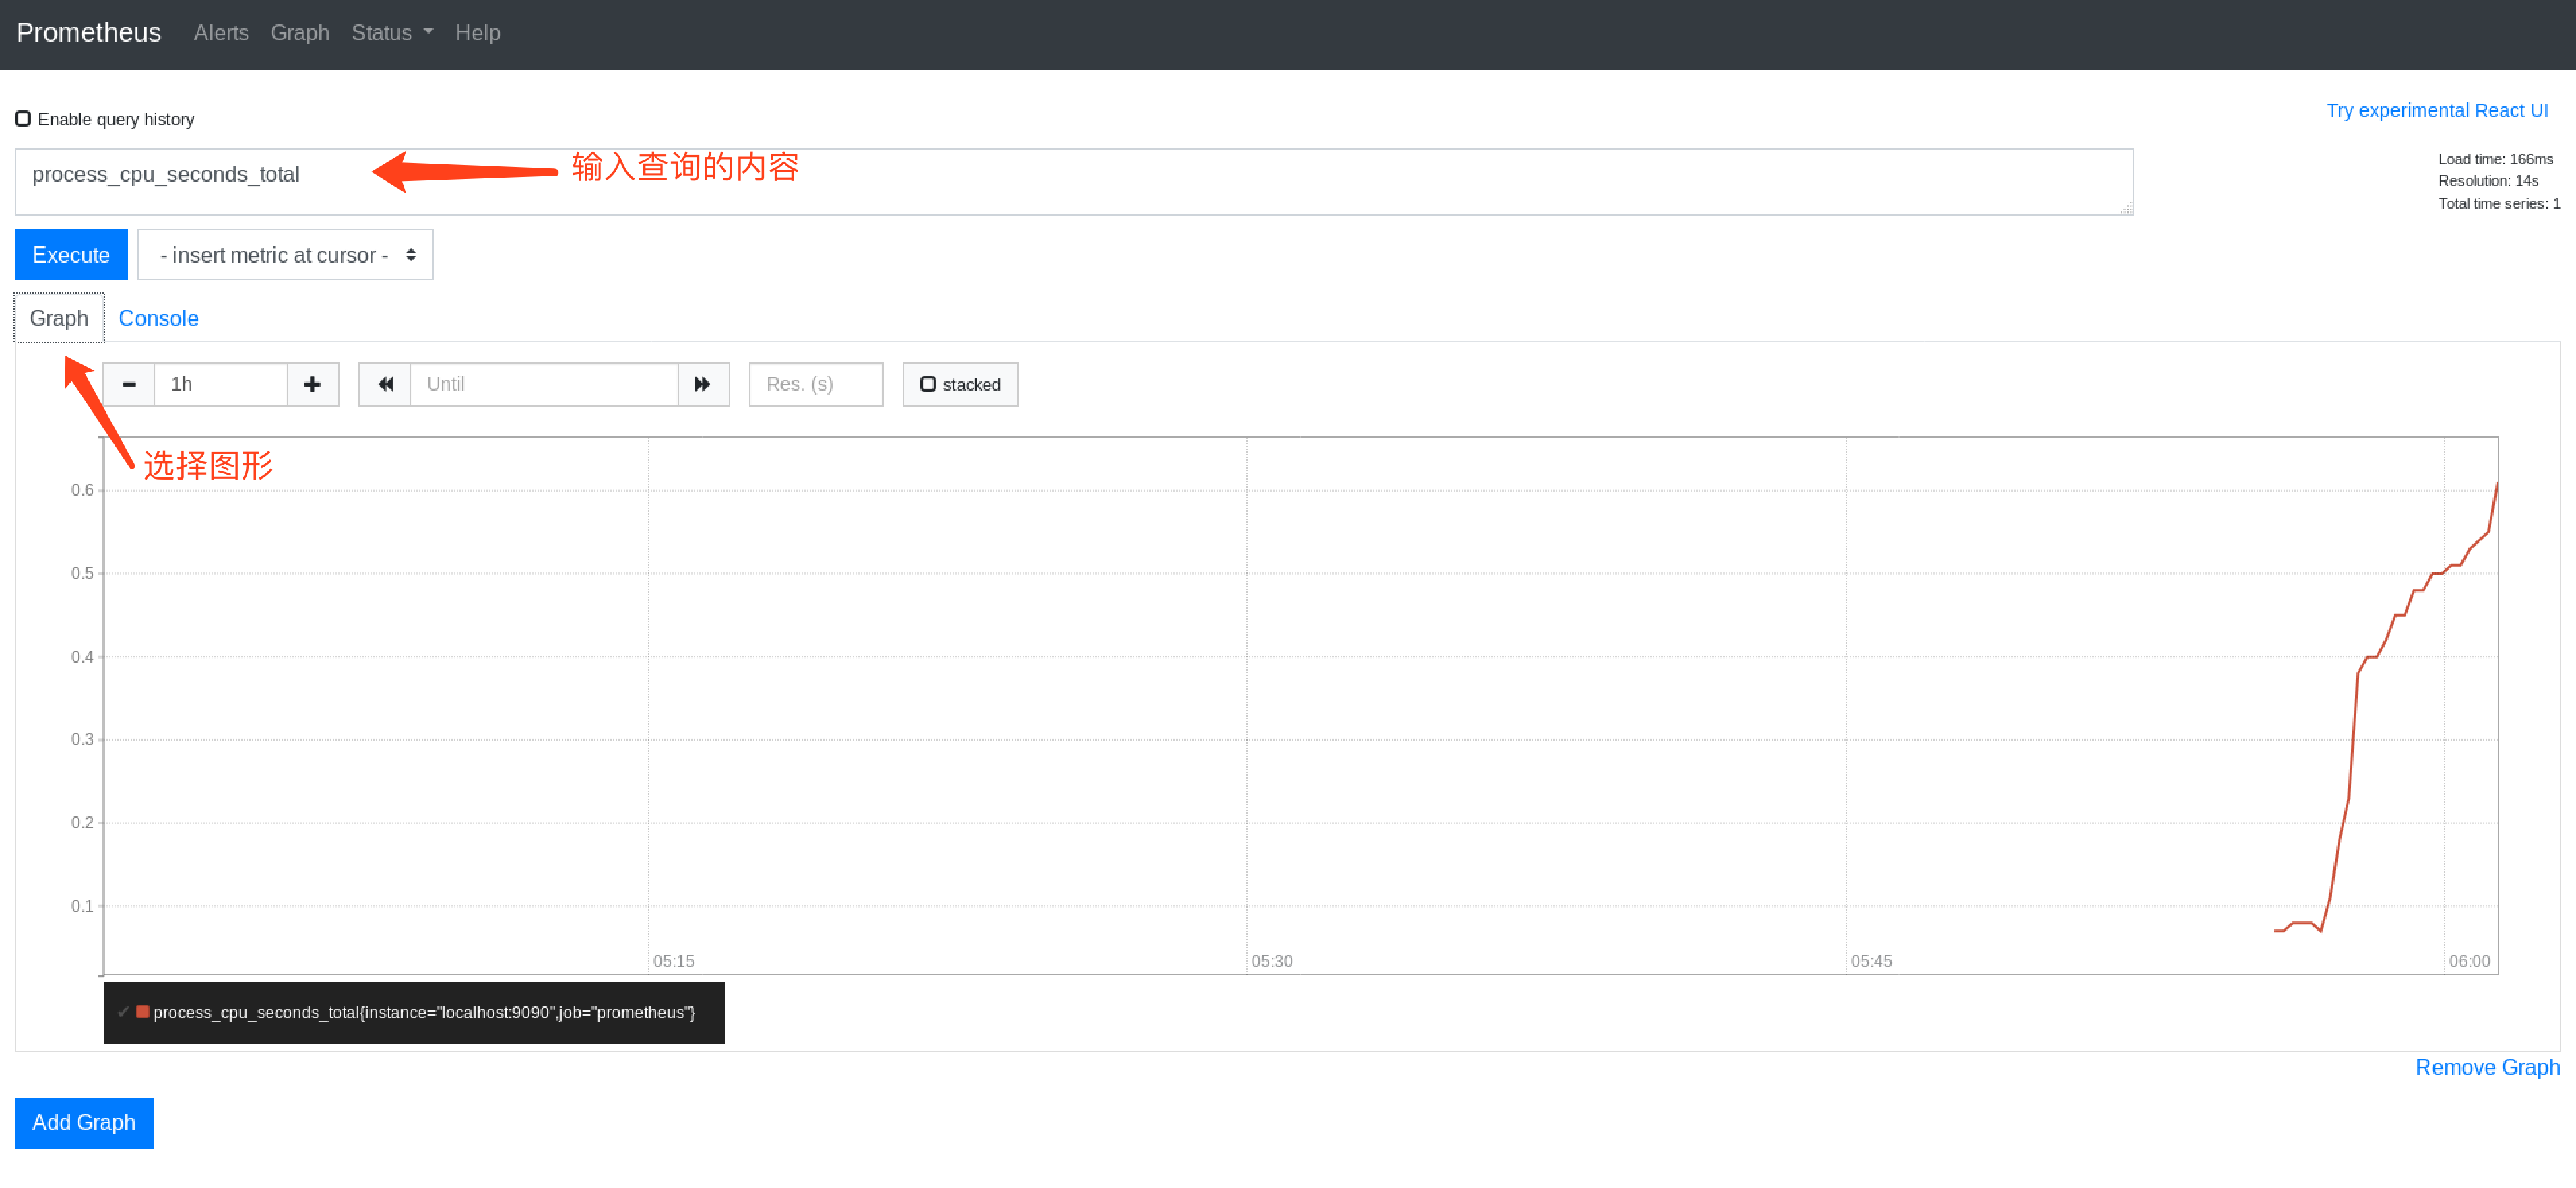
这里输入的是process\_cpu\_seconds\_total,CPU使用状态表就出现了,注意要点一下图表左上角的Graph按钮,默认是在console按钮页面。
### 2.2、监控一个远端业务机器
#### a、安装监控客户端
[root@node2 ~]# tar xf node_exporter-0.18.1.linux-amd64.tar.gz -C /usr/local/
[root@node2 ~]# cd /usr/local/node_exporter-0.18.1.linux-amd64/
[root@node2 node_exporter-0.18.1.linux-amd64]# ls
LICENSE node_exporter NOTICE
#后台启动
[root@node2 node_exporter-0.18.1.linux-amd64]# nohup /usr/local/node_exporter-0.18.1.linux-amd64/node_exporter &
[1] 7281
[root@node2 node_exporter-0.18.1.linux-amd64]# nohup: 忽略输入并把输出追加到"nohup.out"
#业务机器监控插件服务端口
[root@node2 node_exporter-0.18.1.linux-amd64]# lsof -i :9100
COMMAND PID USER FD TYPE DEVICE SIZE/OFF NODE NAME
node_expo 7281 root 3u IPv6 42486 0t0 TCP *:jetdirect (LISTEN)
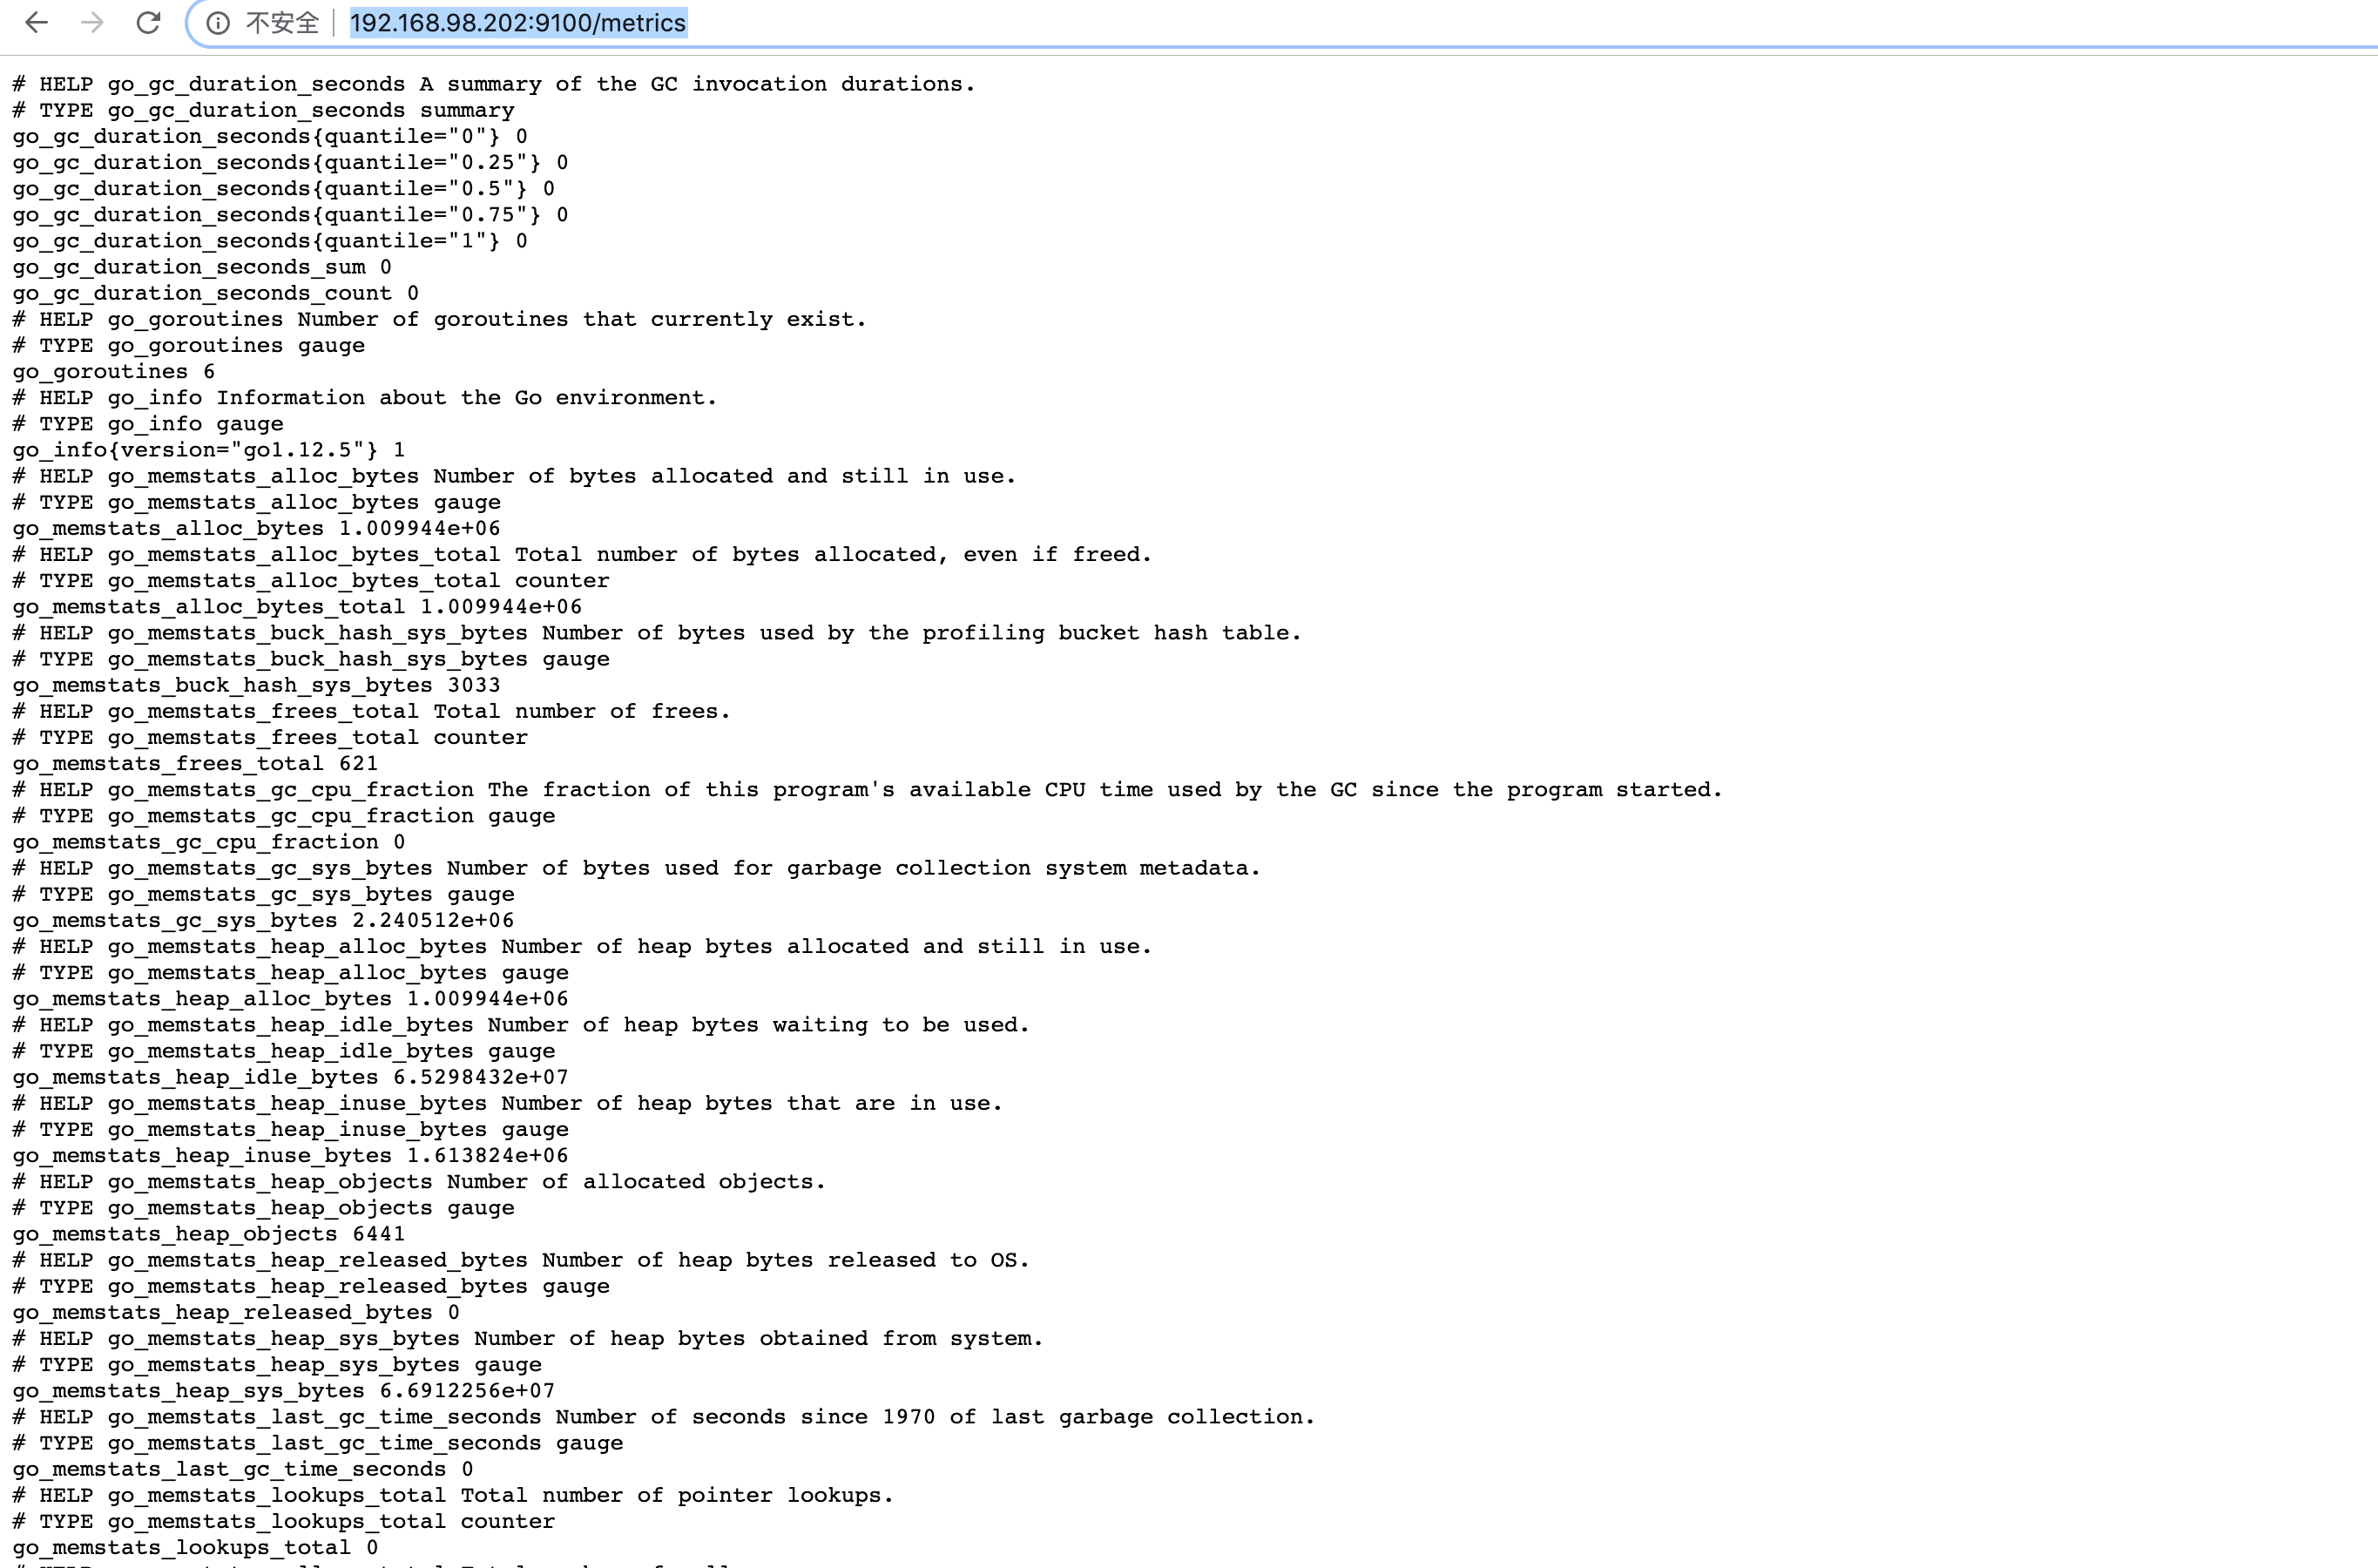
#验证 http://被监控机名称:9100/metrics
http://192.168.98.202:9100/metrics
现在这台机器上的数据被打包成了一个可以访问的页面,所以可以使用浏览器去访问这个页面,看下能否获取到相关的数据,如果能够获取的话就表示没有问题了。
#### b、在prometheus添加监控信息
#被监控主机设置完成之后,需要在prometeus主配置文件中添加被监控机信息
[root@node1 prometheus-2.11.1.linux-amd64]# tail -4 prometheus.yml
- job_name: ‘node2’ #定义名称
static_configs:#定义具体配置- targets: [‘192.168.98.202:9100’]#定义目标
####注意缩进 两个空格
#重启服务
[root@node1 prometheus-2.11.1.linux-amd64]# pkill prometheus
[root@node1 prometheus-2.11.1.linux-amd64]# ./prometheus --config.file=prometheus.yml &
注意:prometheus启动报错
**lock DB directory: resource temporarily unavailable"**
原因:prometheus没有正常关闭,锁文件存在
rm $prometheus_dir/data/lock
#### c、测试验证
设置完查看prometheus页面
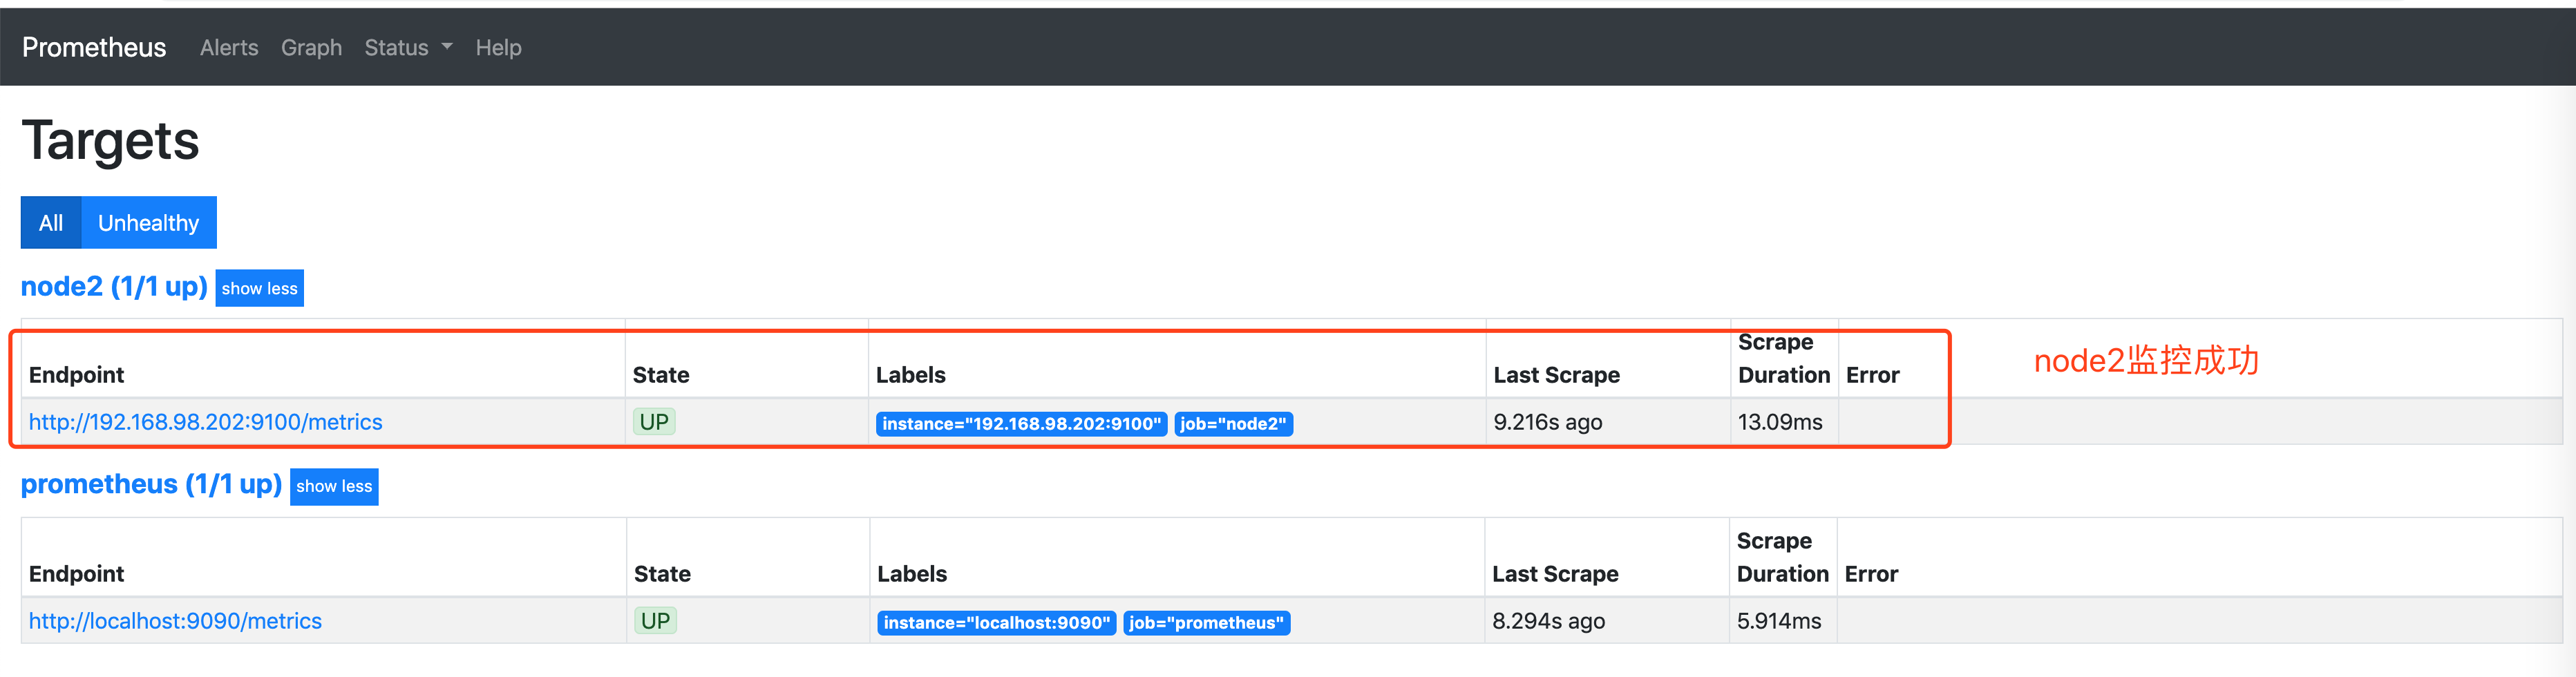
查看Status-Targets页面后可以看到被监控机node2(192.168.98.202)已经在监控列表中了,同时可以通过浏览器看看其监控数据。
在浏览器中输入http://192.168.98.202:9100/metrics 能看到数据
### 2.3、监控一个服务:mysql
要监控mysql需要两个条件,一个是系统中有mysql,另一个是要有监控插件,现在监控插件已经下载好了,所以我们要先安装mysql,然后进行相应的授权,让插件可以获取到所需要的信息,然后再设置相关插件,修改prometheus配置文件
#### a、部署mysql业务
[root@node2 node_exporter-0.18.1.linux-amd64]# dnf -y install mariadb-server mariadb
[root@node2 mysqld_exporter-0.12.0.linux-amd64]# systemctl enable mariadb
Created symlink from /etc/systemd/system/multi-user.target.wants/mariadb.service to /usr/lib/systemd/system/mariadb.service.
[root@node2 mysqld_exporter-0.12.0.linux-amd64]# systemctl start mariadb
#创建监控用户
MariaDB [(none)]> grant select,replication client,process on *.* to ‘hello’@‘localhost’ identified by ‘123456’;
Query OK, 0 rows affected (0.00 sec)
MariaDB [(none)]> flush privileges;
Query OK, 0 rows affected (0.00 sec)
#### b、部署监控插件
[root@node2 ~]# tar xf mysqld_exporter-0.12.1.linux-amd64.tar.gz -C /usr/local
[root@node2 ~]# vim /usr/local/mysqld_exporter-0.12.1.linux-amd64/.my.cnf
[root@node2 ~]# cat /usr/local/mysqld_exporter-0.12.1.linux-amd64/.my.cnf
[client]
user=hello
password=123456
#启动
[root@node2 ~]# nohup /usr/local/mysqld_exporter-0.12.1.linux-amd64/mysqld_exporter --config.my-cnf=/usr/local/mysqld_exporter-0.12.1.linux-amd64/.my.cnf &
[root@node2 ~]# lsof -i :9104
COMMAND PID USER FD TYPE DEVICE SIZE/OFF NODE NAME
mysqld_ex 7698 root 3u IPv6 46415 0t0 TCP *:peerwire (LISTEN)
#### c、在prometheus主配置文件中添加监控
[root@node1 prometheus-2.11.1.linux-amd64]# tail -10 prometheus.yml
static_configs:
- targets: [‘localhost:9090’]
-
job_name: ‘node2’
static_configs:- targets: [‘192.168.98.202:9100’]
-
job_name: ‘mariadb’
static_configs:- targets: [‘192.168.98.202:9104’]
#### d、重启prometheus服务
[root@node1 prometheus-2.11.1.linux-amd64]# pkill prometheus
[root@node1 prometheus-2.11.1.linux-amd64]# ./prometheus --config.file=prometheus.yml &
#### e、通过监控页面查看服务
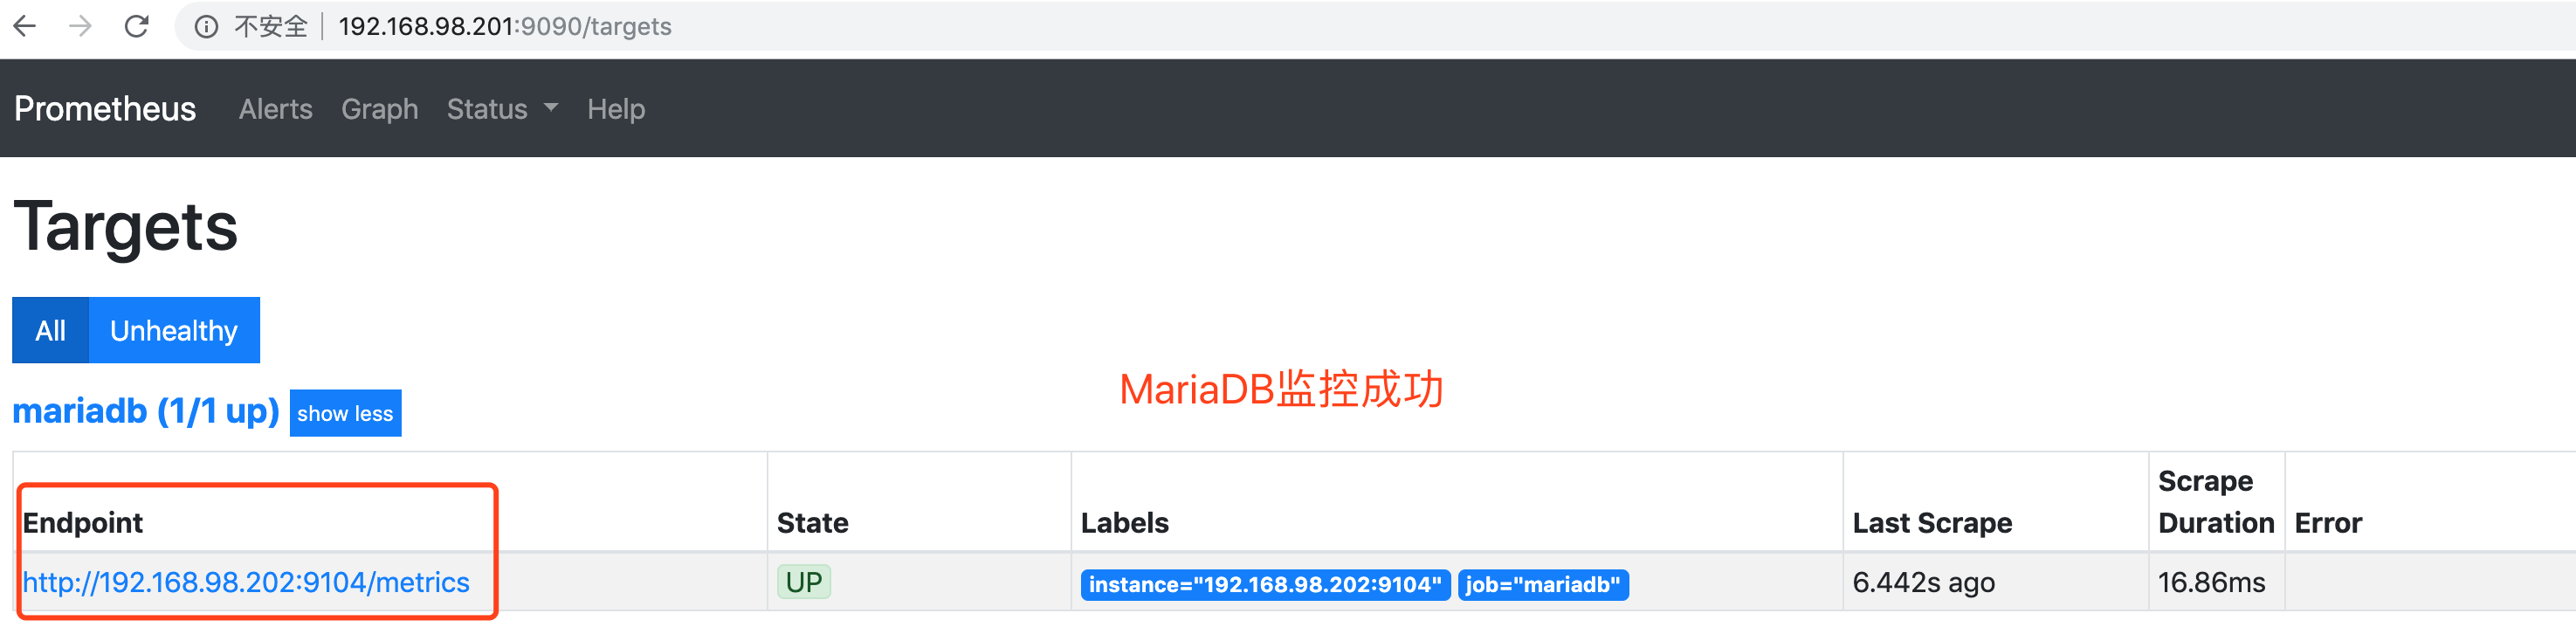
通过Graph页面看看相关图表
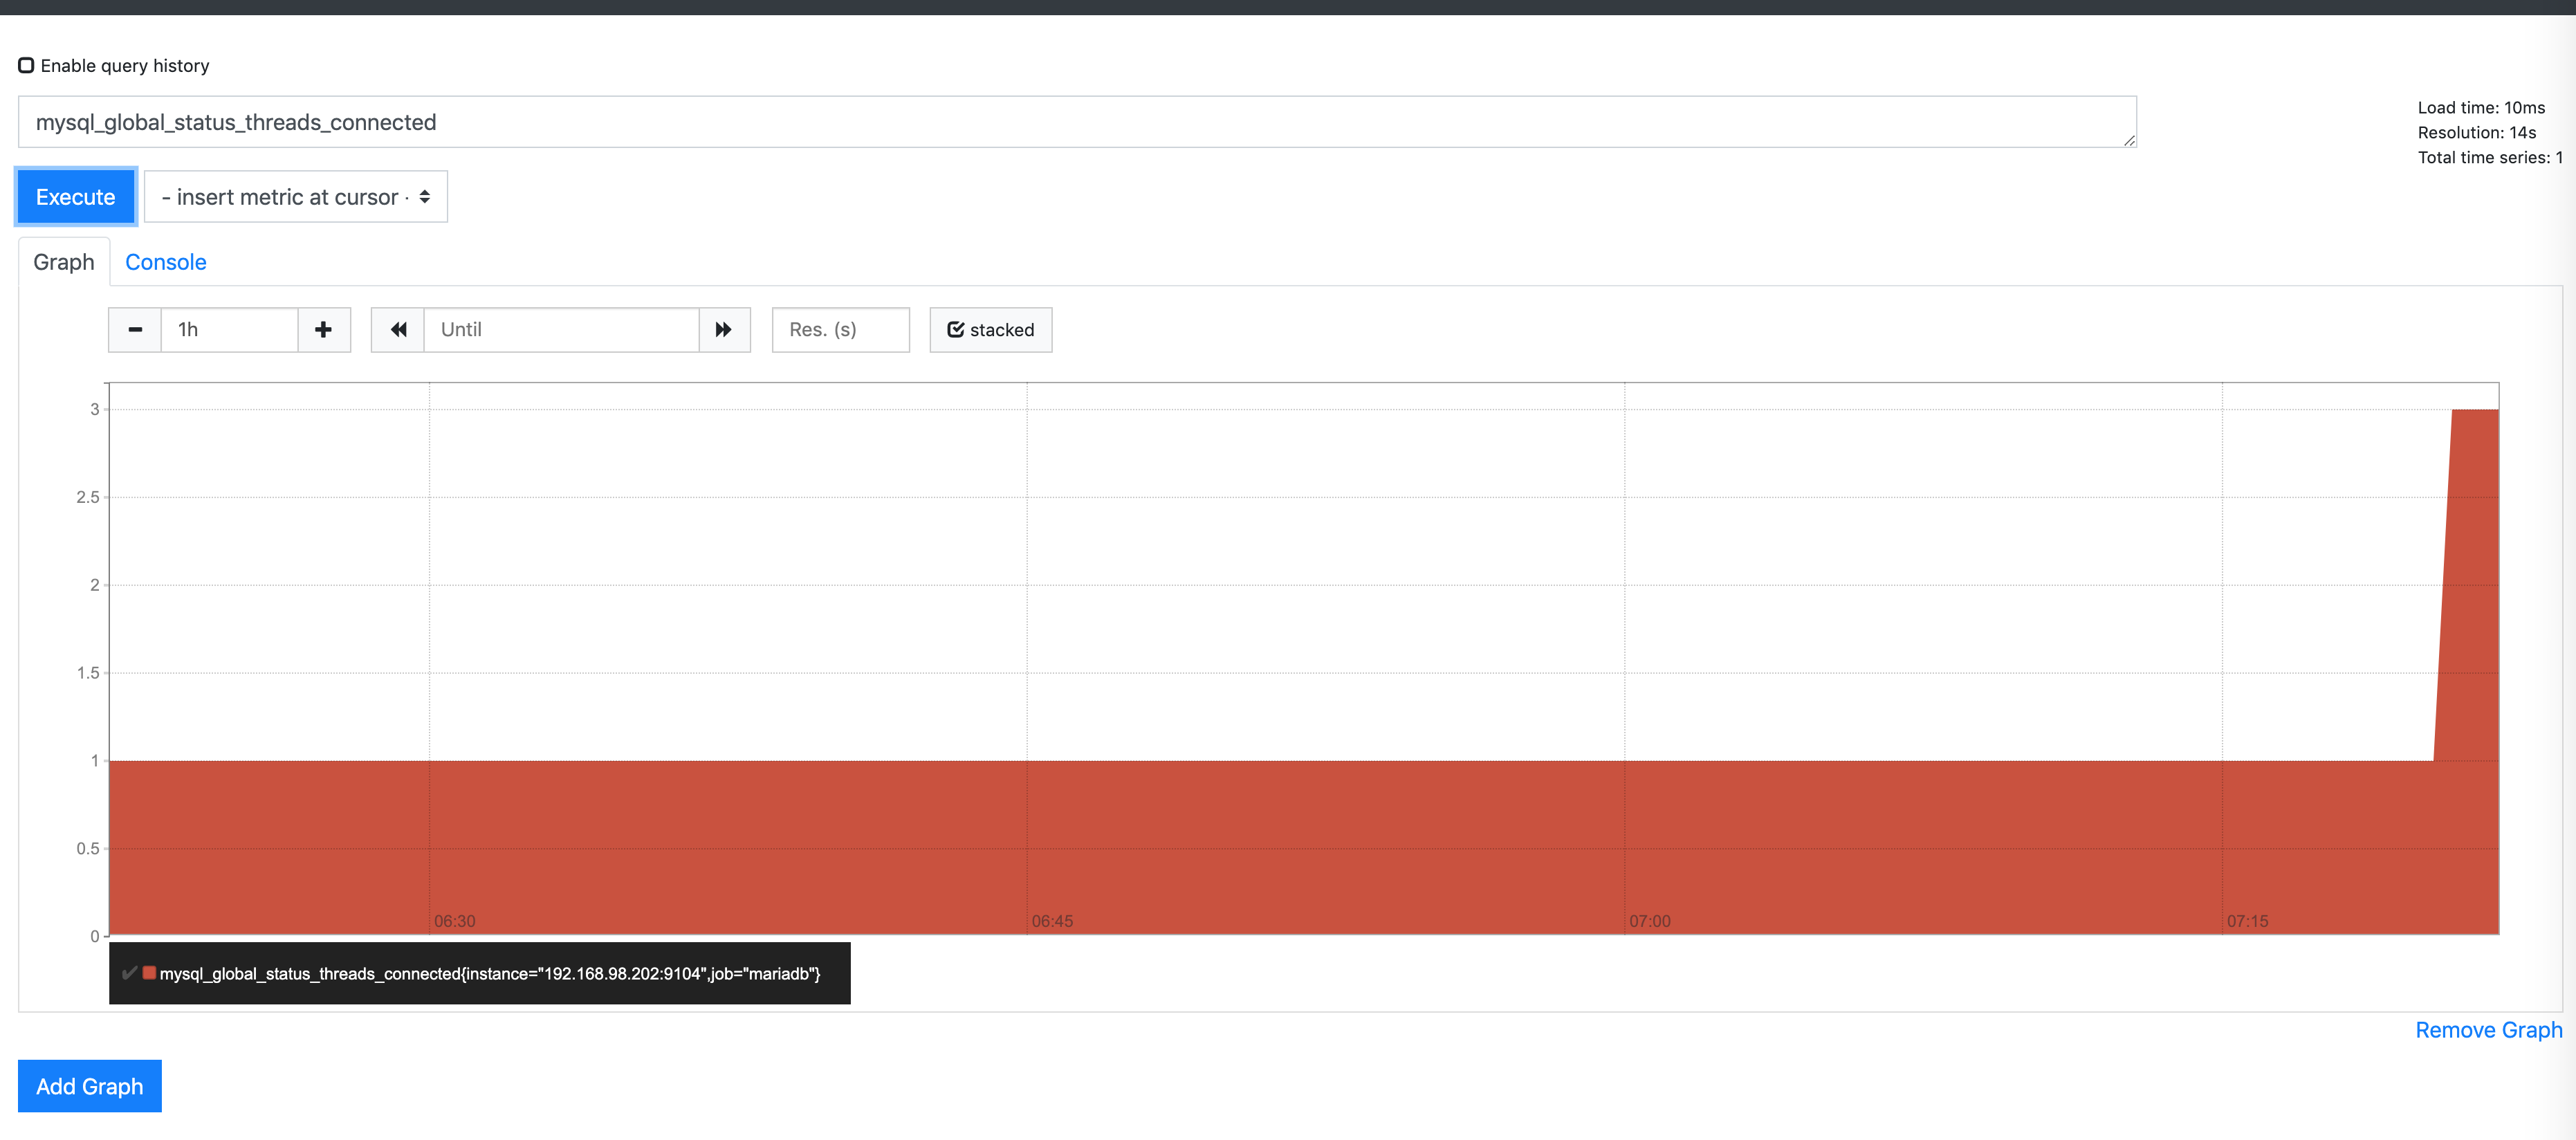
可以勾选stacked将图形显示为堆叠状。
## 三、prometheus Grafana数据展示及告警
prometheus这个监控软件的展示界面实在是有些难看,所以换一个展示方式:Grafana,Grafana是一个开源的度量分析和可视化工具(没有监控功能),可以通过将采集的数据分析,查询,然后进行可视化的展示,并能实现报警。
### 3.1、部署grafana
#### a、grafana安装
软件包获得
官方网站: grafana:https://grafana.com/
**软件包安装**
[root@manage01 ~]# dnf -y localinstall grafana-6.6.1-1.x86_64…
**服务启动**
#服务启动
[root@manage01 ~]# systemctl enable grafana-server
Created symlink from /etc/systemd/system/multi-user.target.wants/grafana-server.service to /usr/lib/systemd/system/grafana-server.service.
[root@manage01 ~]# systemctl start grafana-server
#验证启动
[root@manage01 ~]# lsof -i :3000
COMMAND PID USER FD TYPE DEVICE SIZE/OFF NODE NAME
grafana-s 17154 grafana 8u IPv6 53939 0t0 TCP *:hbci (LISTEN)
grafana启动成功后,可以通过页面访问到grafana页面
**在浏览器中输入http://IP或者域名:3000**

**要求输入账号密码:** admin/admin(默认)
当看到这个页面说明grafana已经安装成功并且工作了。
输入账号密码登录时,由于是第一次登录,为了安全要求必须更改密码后才能登录

输入两次新密码后,点击save即可登录
#### b、grafana页面设置-添加prometheus数据源
登录成功后,页面会为你提供一个使用引导线,按着引导需要都设置一下,主要为grafana设置数据源。
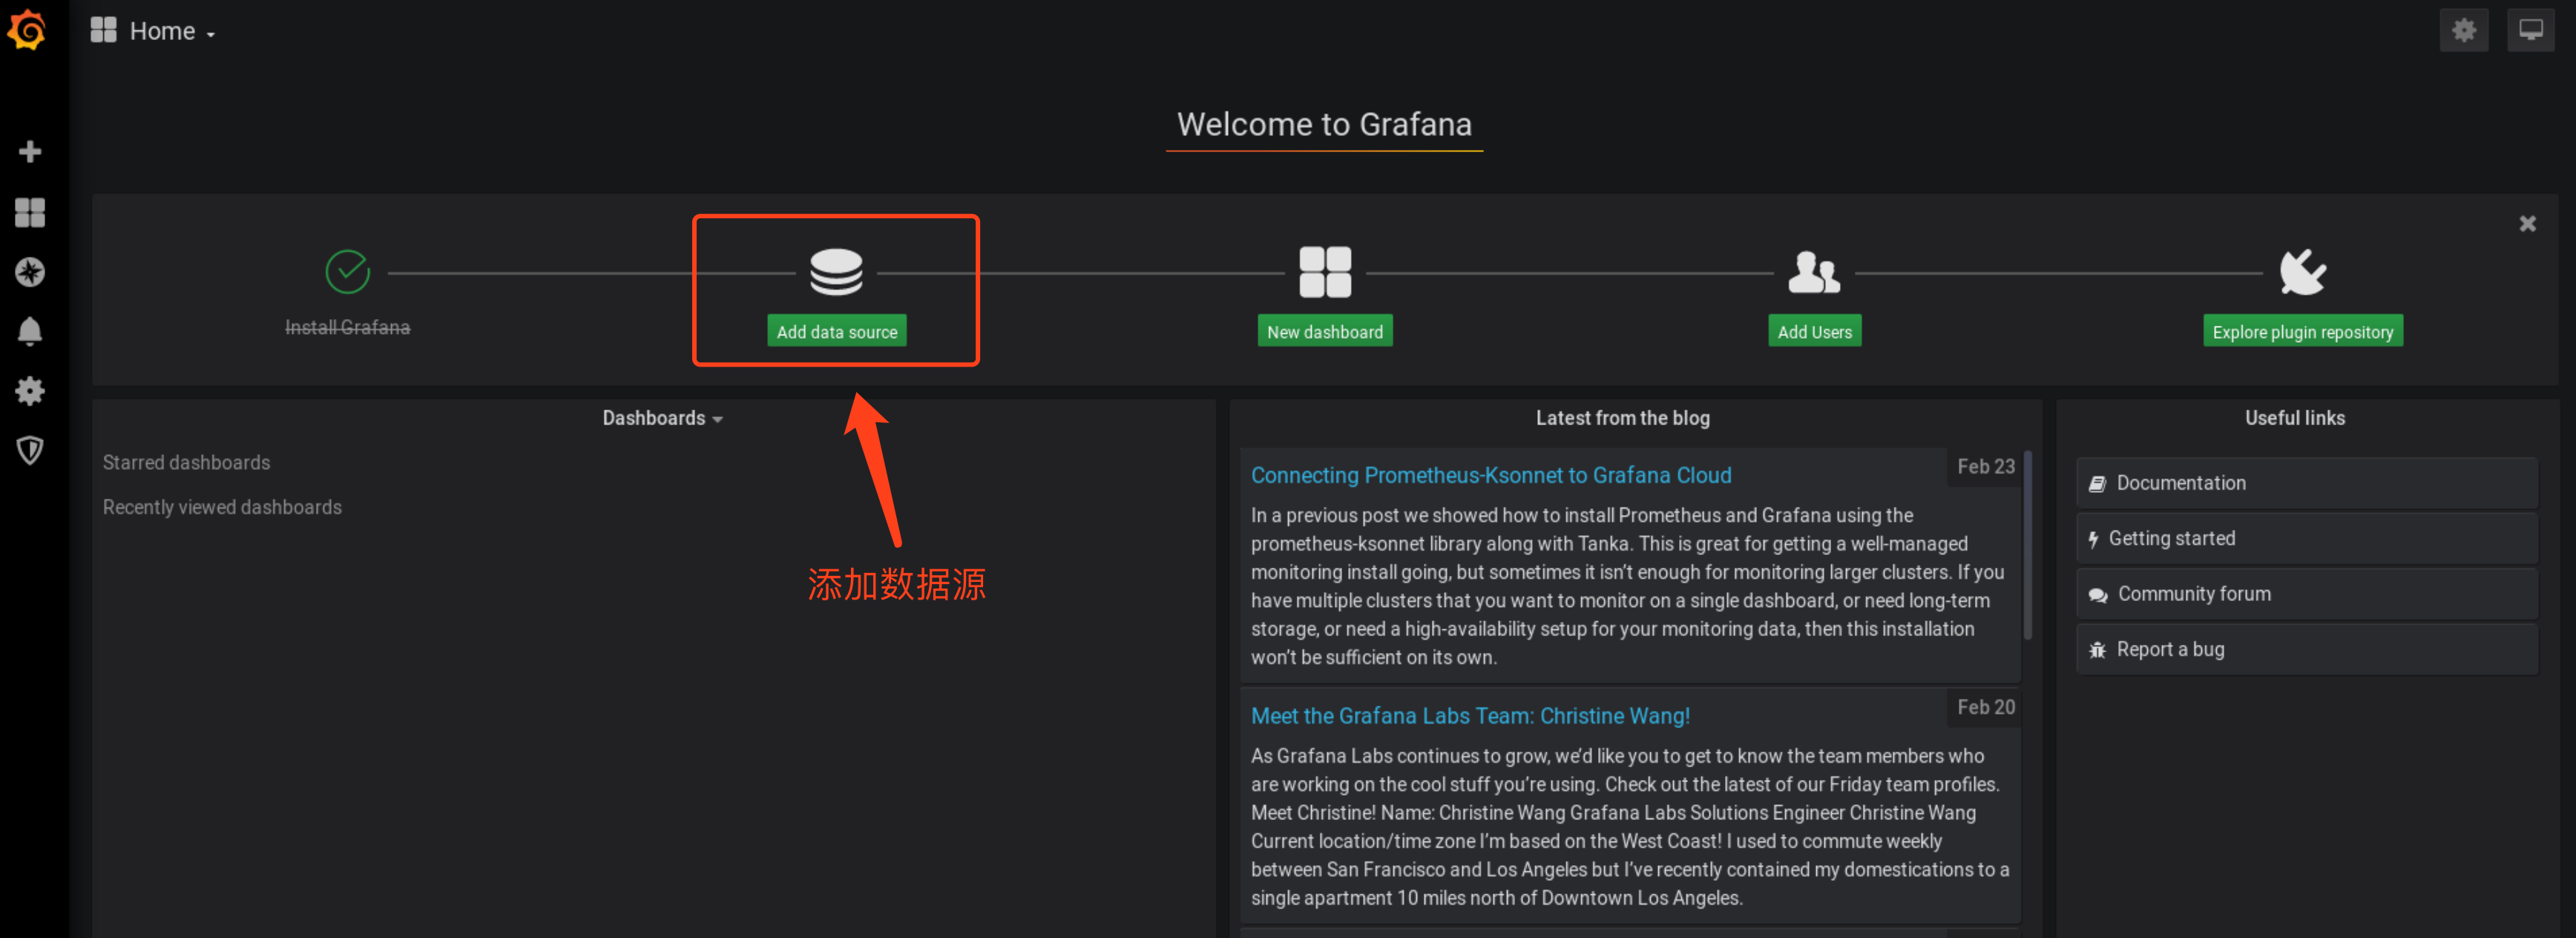
从图标上可以看出,我们需要设置数据源—展示仪表盘—添加用户这些操作。
点击Add data source 增加数据源
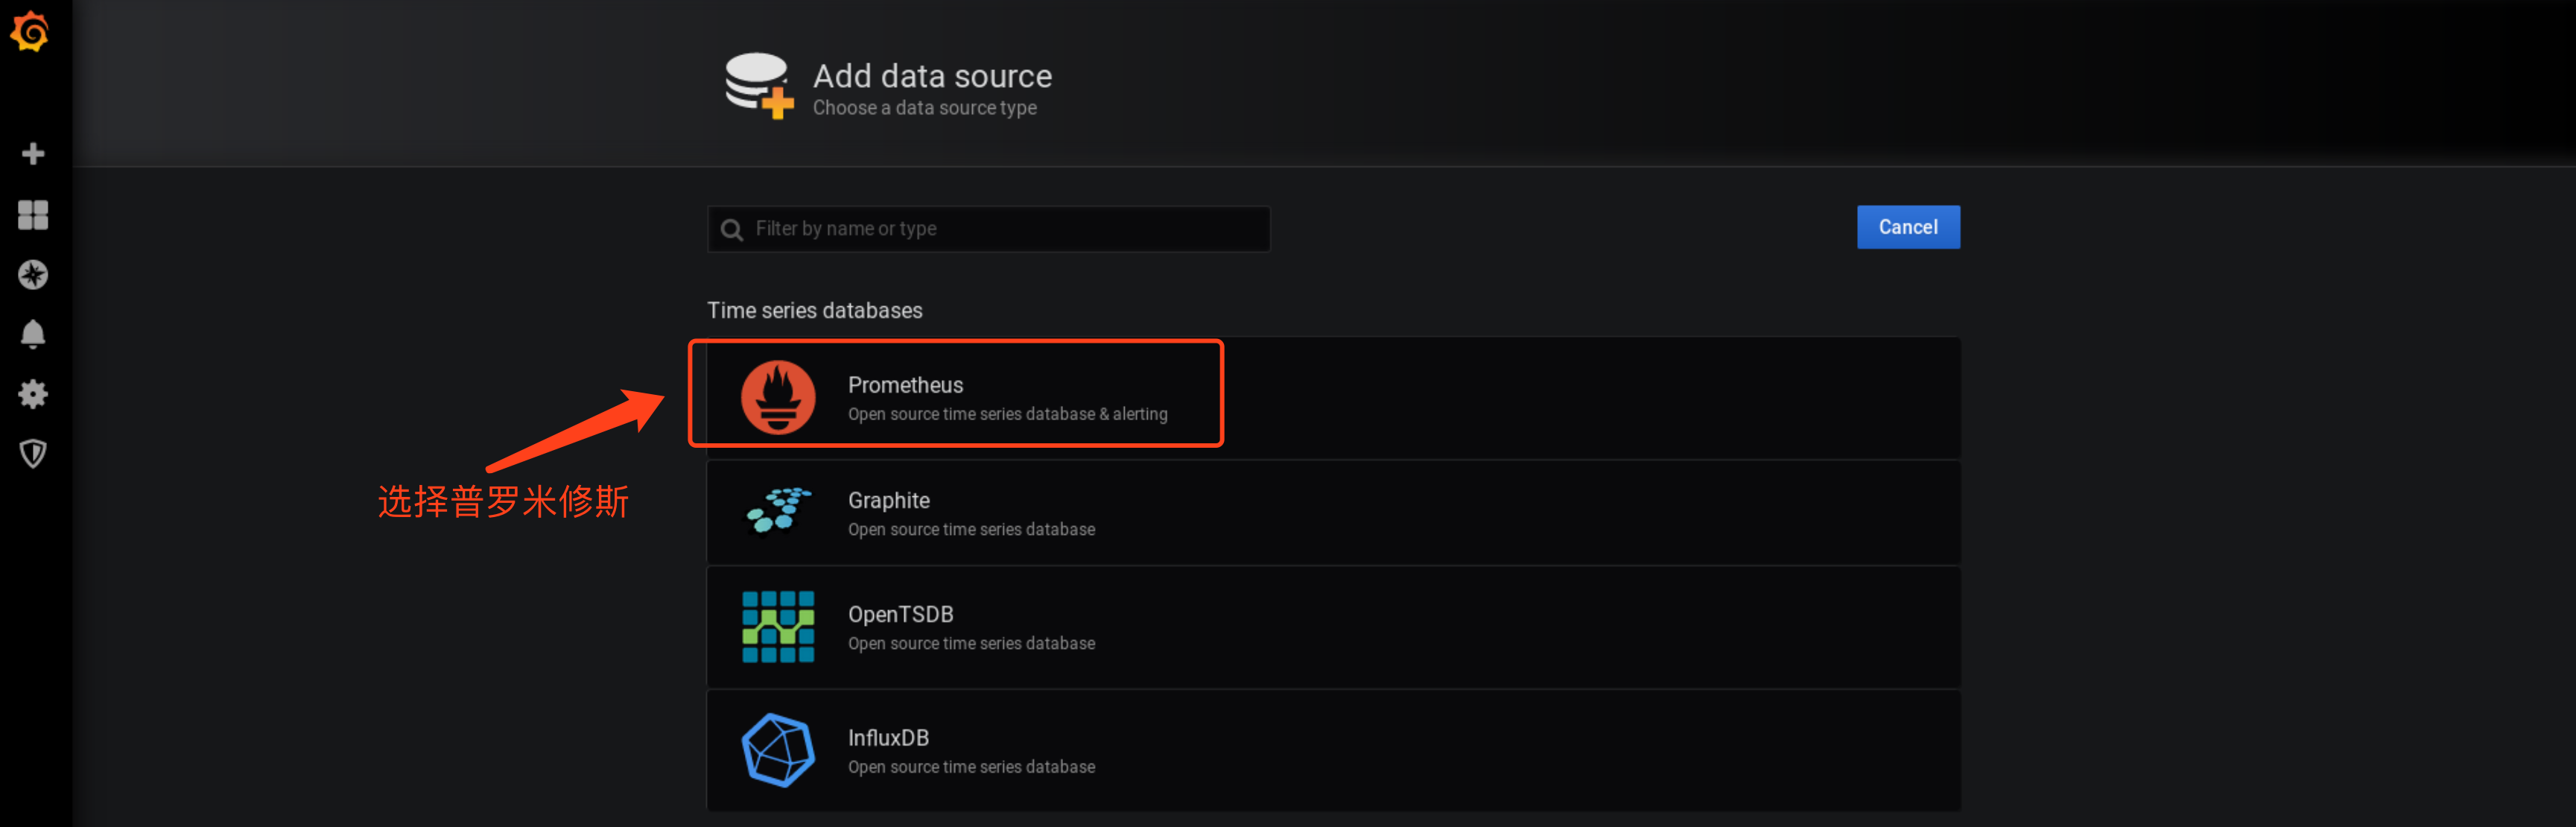
选择Prometheus进入下一步。
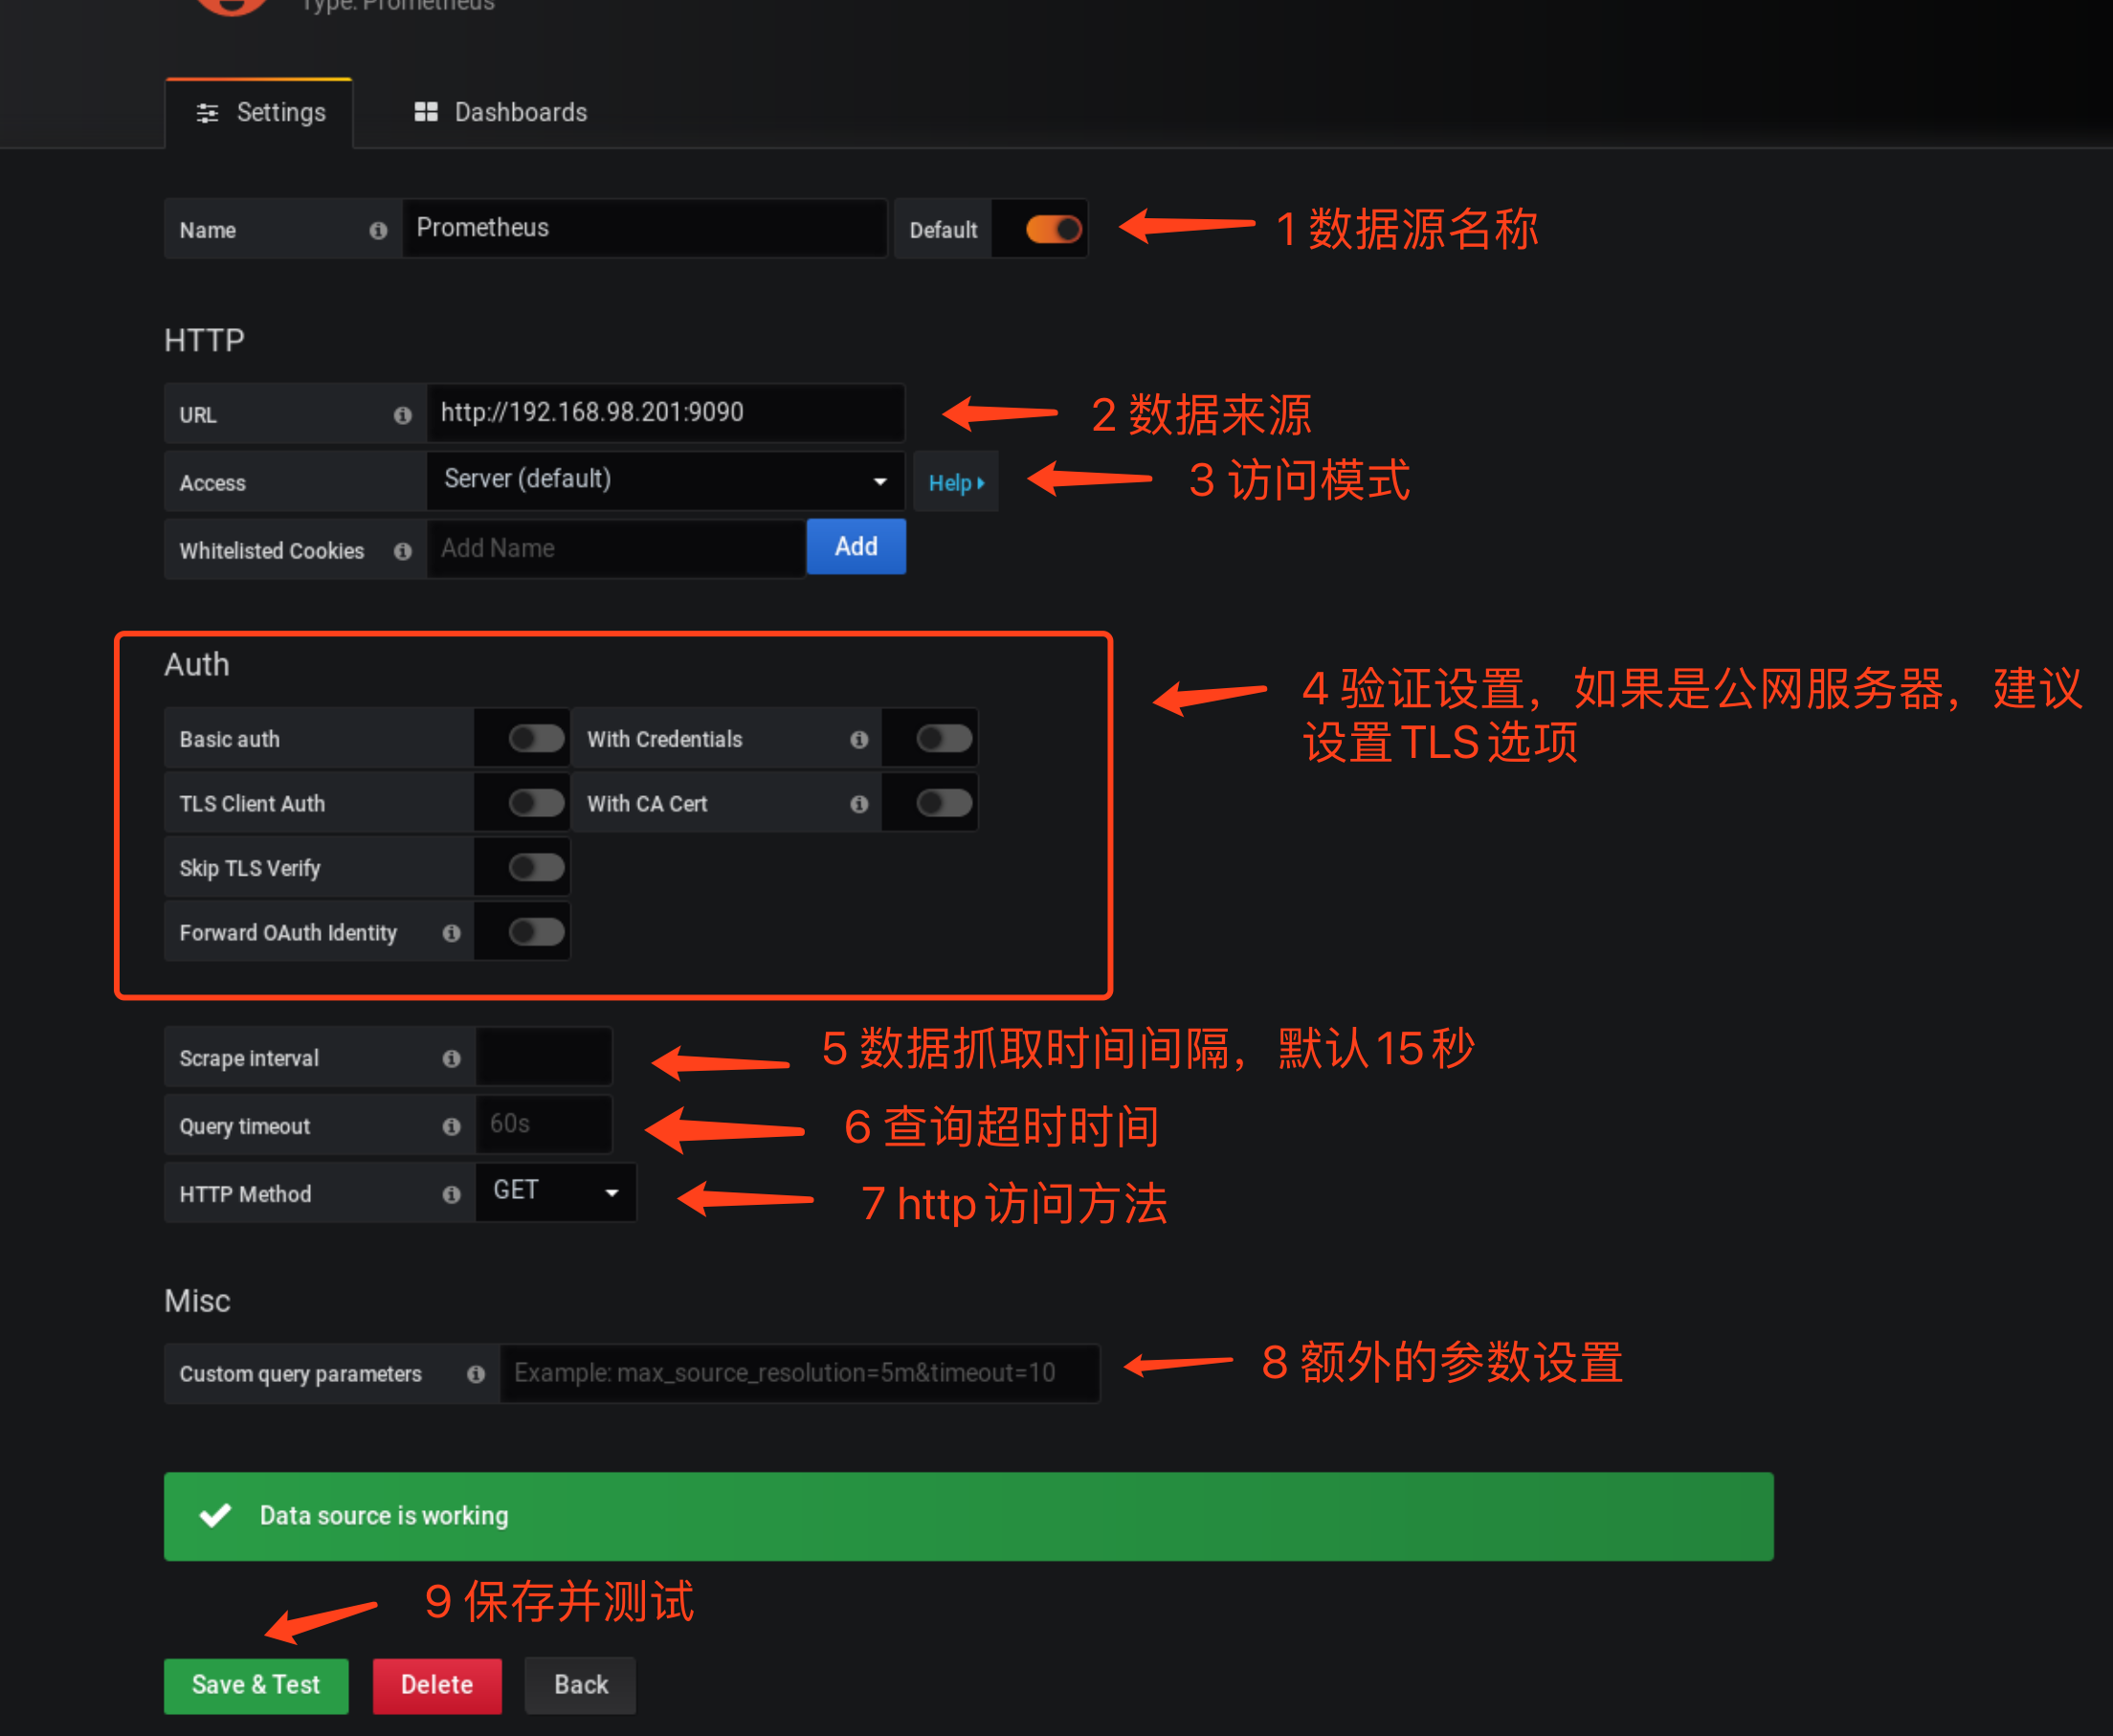
auth部分的设置,主要是与HTTPS配合使用的,如果使用的是https就需要证书,认证等,需要对此部分内容进行一些配置
按照页面要求填入对应信息即可,一般错误都是因为输入错误造成的。点击Save & Test后保存成功
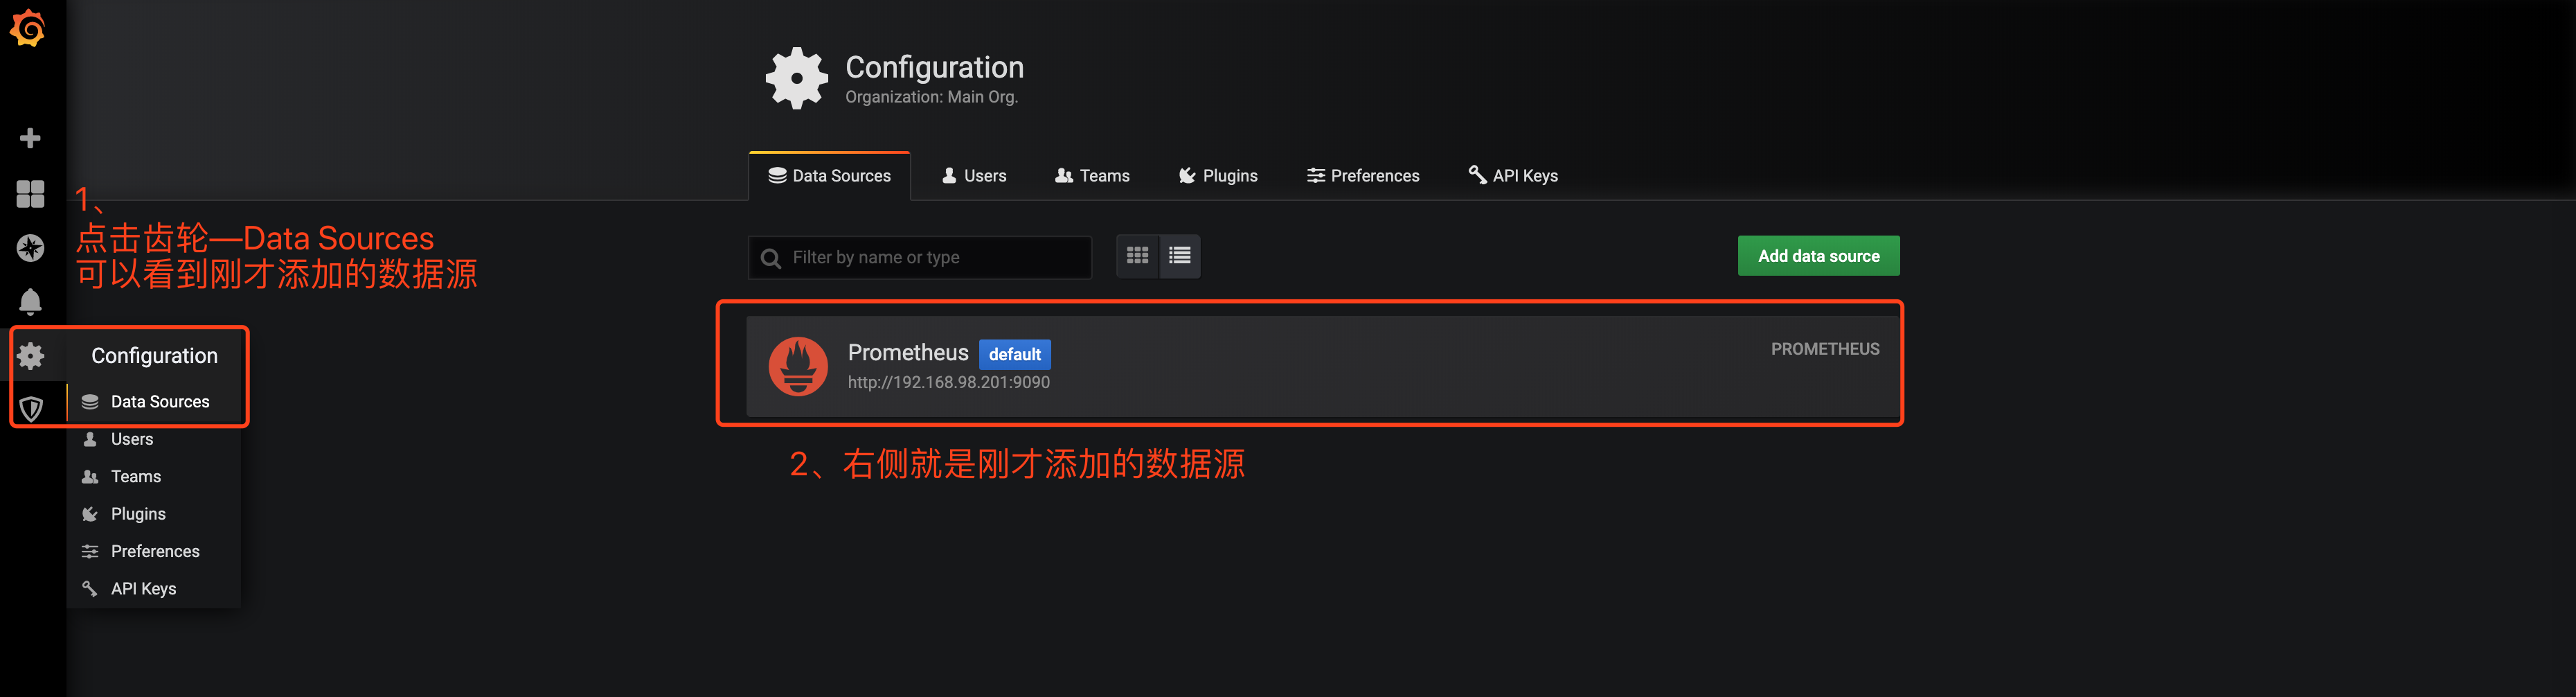
通过左侧导航栏中的齿轮图标下拉菜单中的Data Source看到刚才添加的数据源
### 3.2、绘制图形
#### a、仪表盘管理
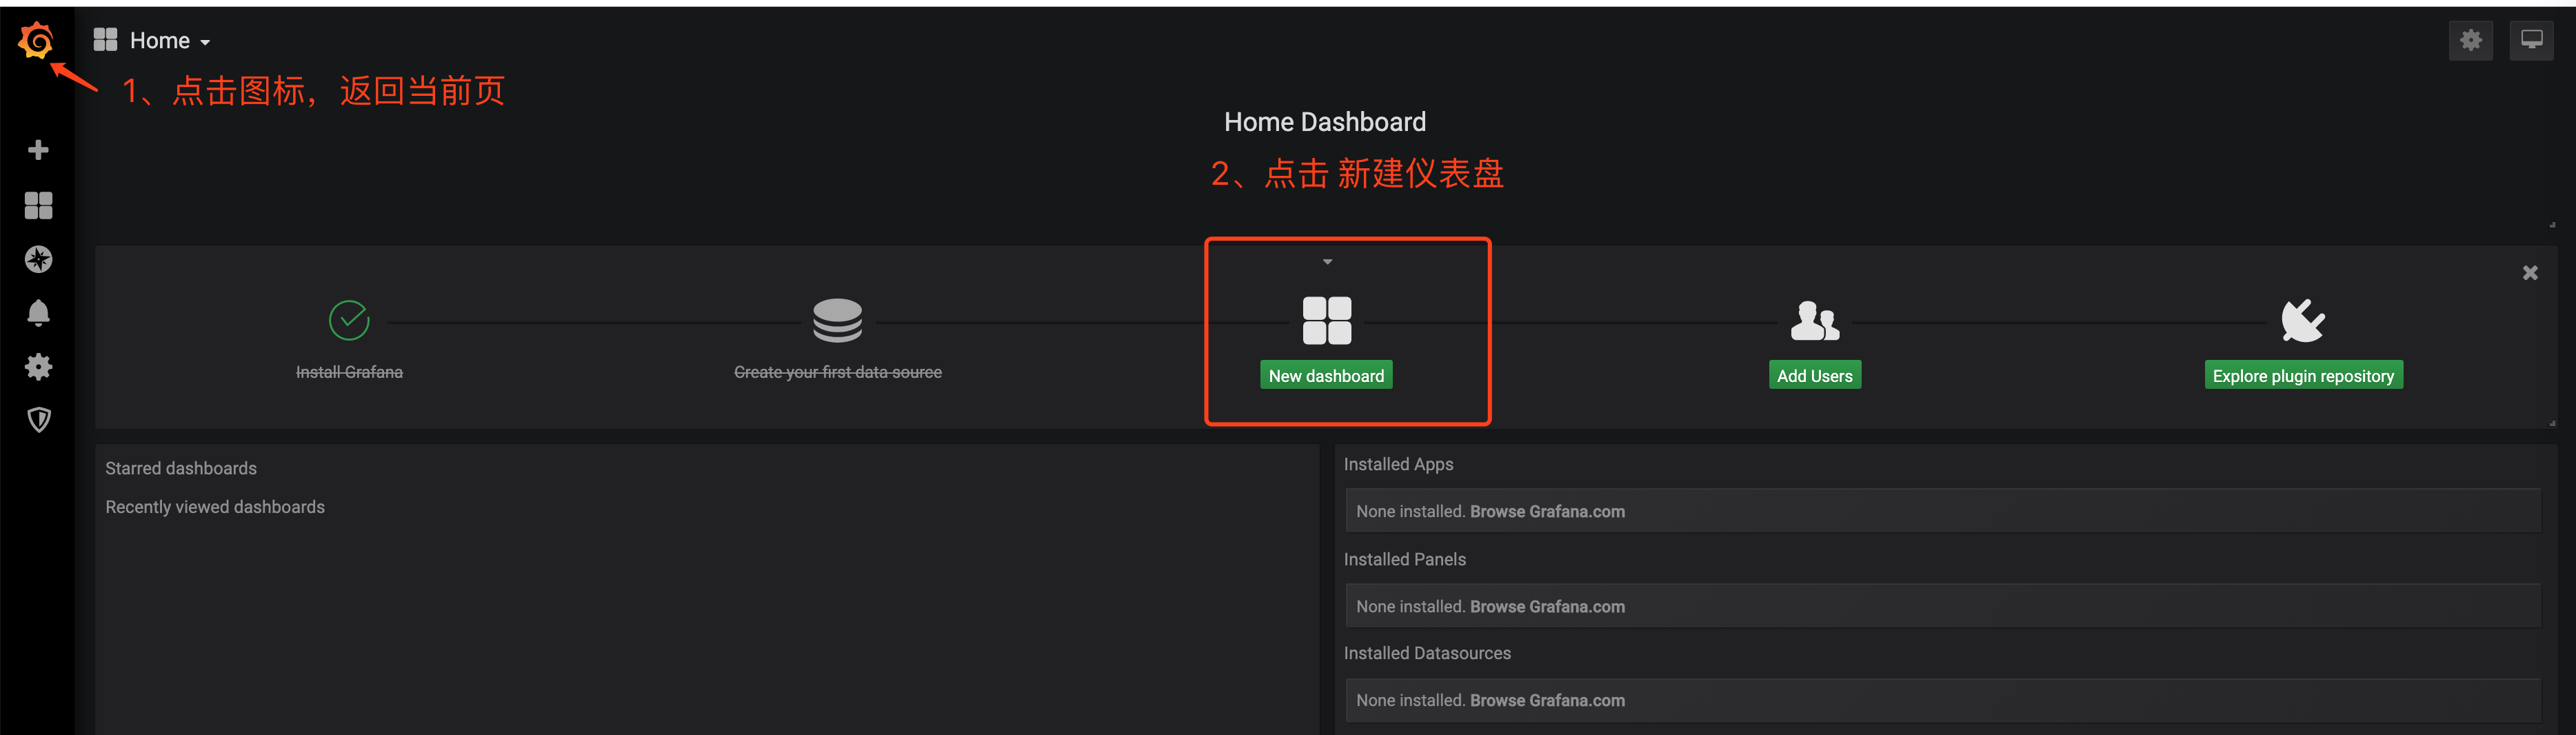
添加完数据源后,可以继续添加仪表盘,这样我们就能以图表的方式看到数据,继续点击New Dshboard
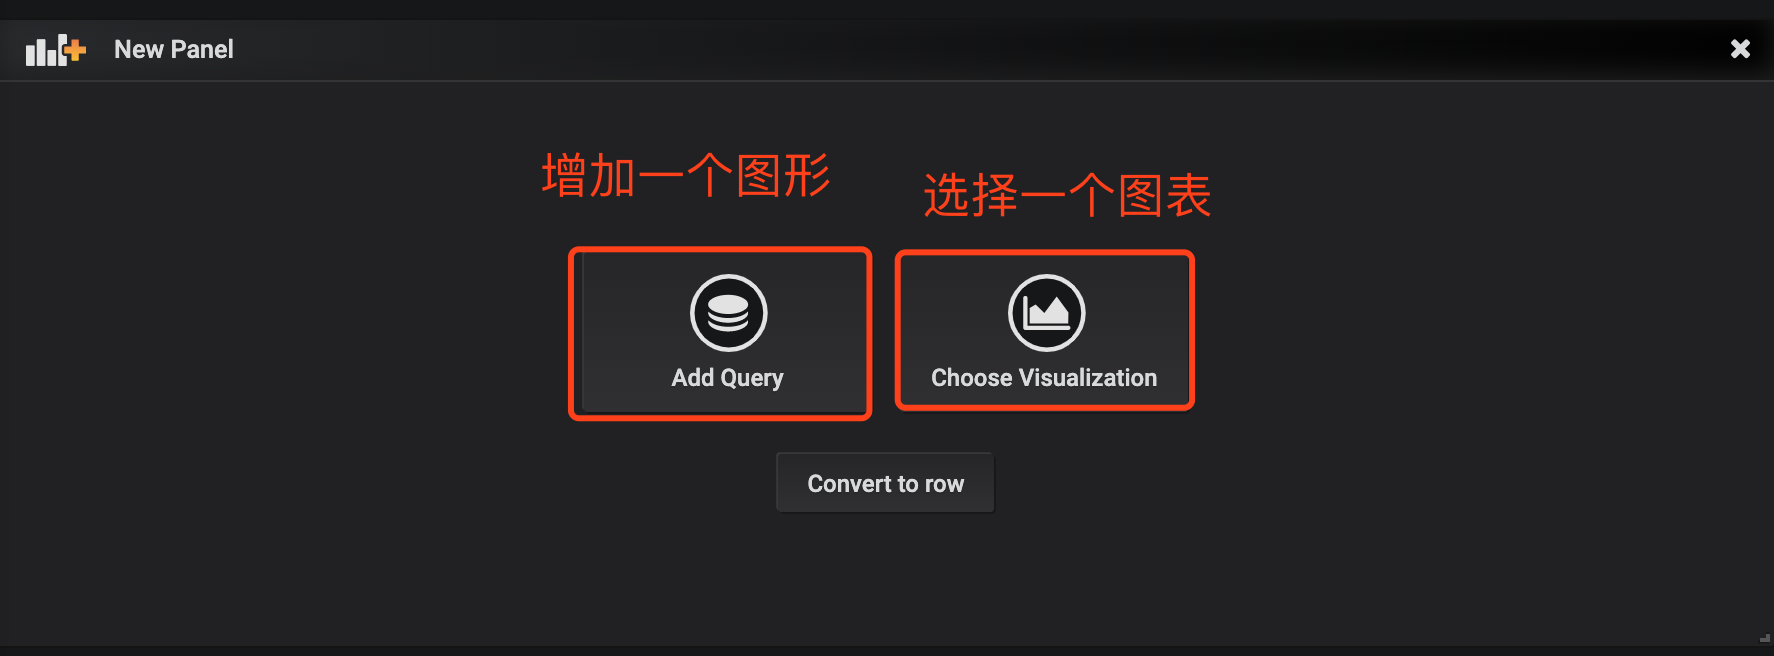
图上显示你可以增加一个图形到仪表盘,也可以选择一个样式图标
这里任选一个都可以,这个版本不知道作者怎么想的,其实功能都能实现
这里选择第一个 Add query
进入页面后,左侧有四个标识,分别是
数据源

图表

设置

告警

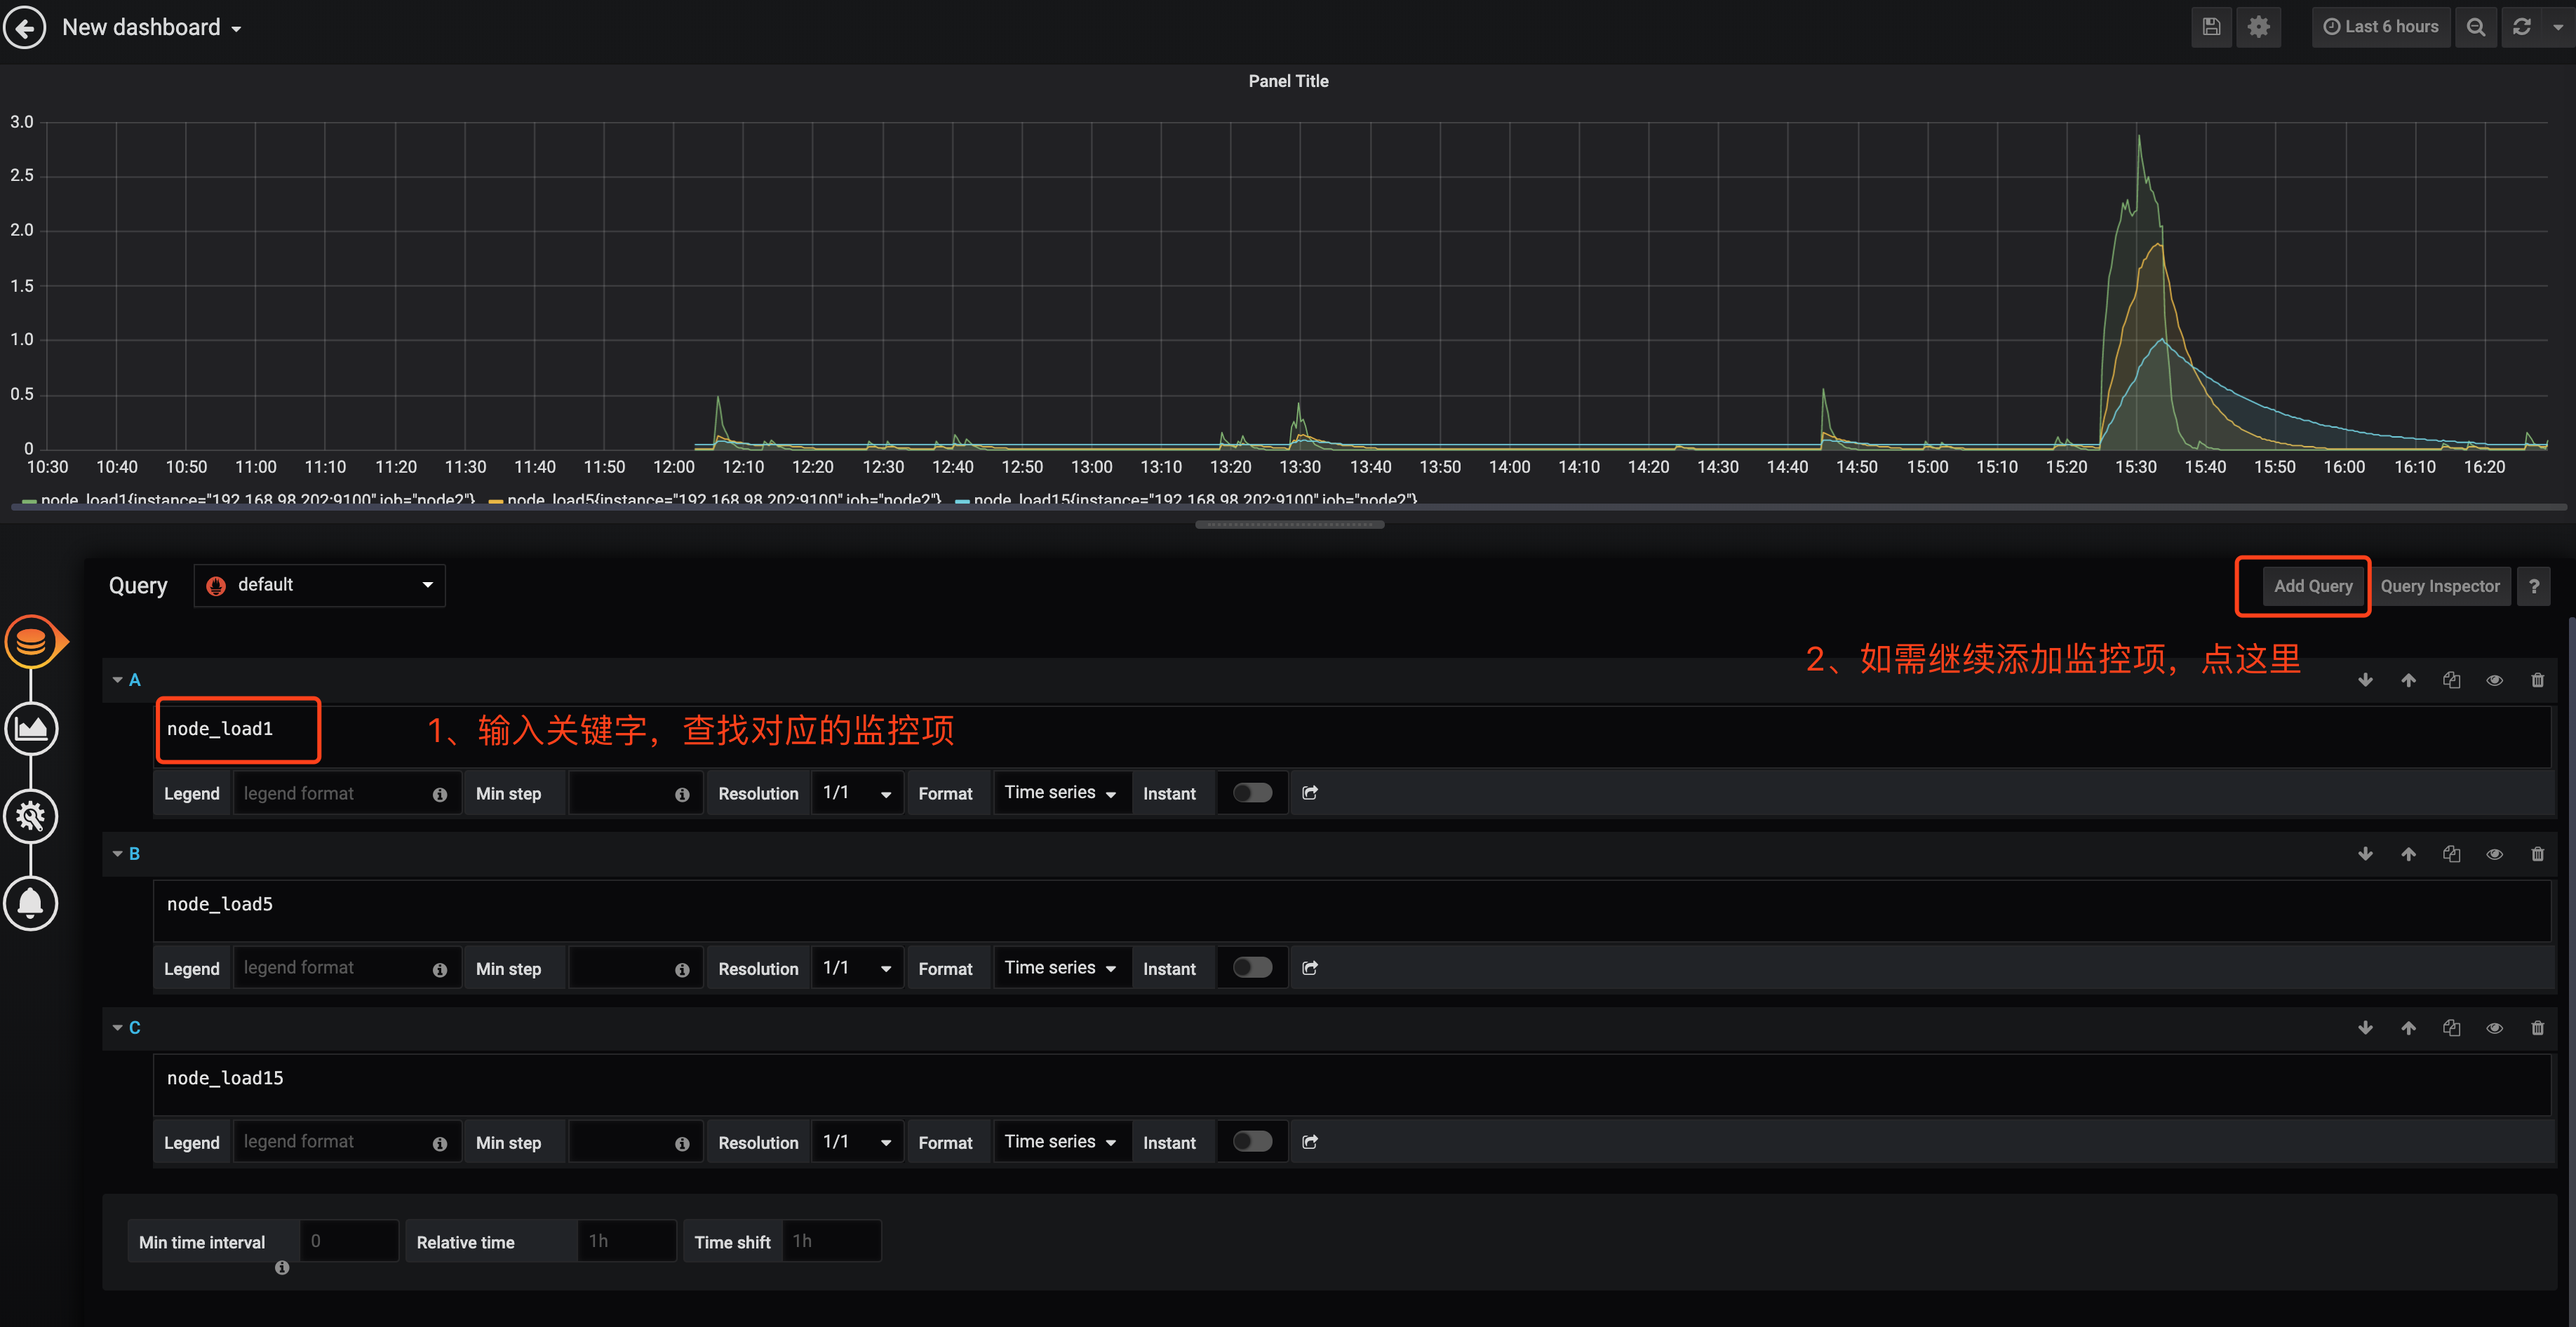
我们按照图标步骤先来设置数据源
如上图,在A项中根据需求,匹配你的监控项,如果有多项,可以通过右上角的add query增加,设置完成后就可以设置图表样式了,点击图表
**自我介绍一下,小编13年上海交大毕业,曾经在小公司待过,也去过华为、OPPO等大厂,18年进入阿里一直到现在。**
**深知大多数Linux运维工程师,想要提升技能,往往是自己摸索成长或者是报班学习,但对于培训机构动则几千的学费,着实压力不小。自己不成体系的自学效果低效又漫长,而且极易碰到天花板技术停滞不前!**
**因此收集整理了一份《2024年Linux运维全套学习资料》,初衷也很简单,就是希望能够帮助到想自学提升又不知道该从何学起的朋友,同时减轻大家的负担。**
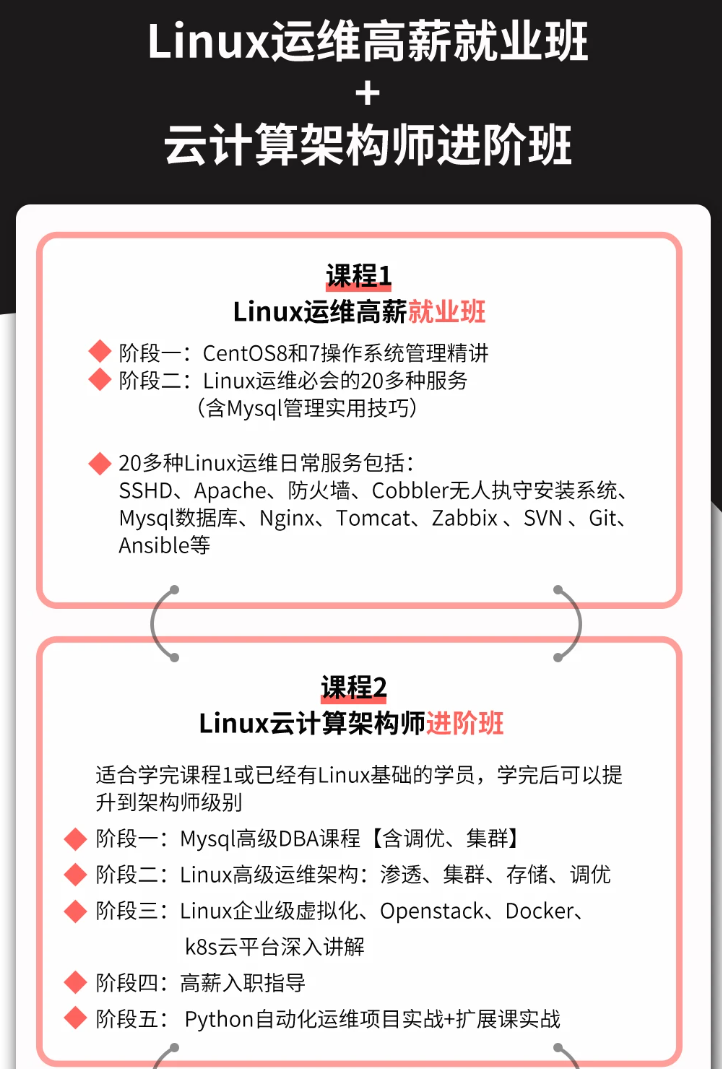


**既有适合小白学习的零基础资料,也有适合3年以上经验的小伙伴深入学习提升的进阶课程,基本涵盖了95%以上Linux运维知识点,真正体系化!**
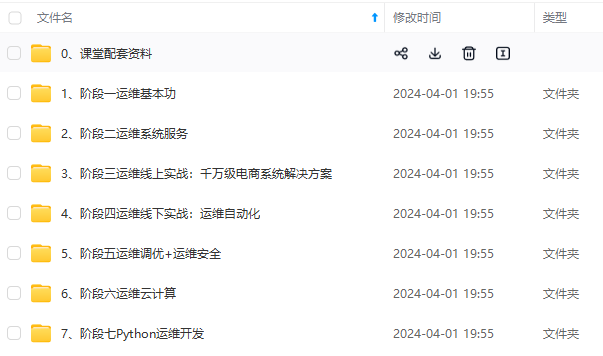
**由于文件比较大,这里只是将部分目录大纲截图出来,每个节点里面都包含大厂面经、学习笔记、源码讲义、实战项目、讲解视频,并且后续会持续更新**
**如果你觉得这些内容对你有帮助,可以添加VX:vip1024b (备注Linux运维获取)**

0A1-1712750844355)]
[外链图片转存中...(img-ocd1F3BN-1712750844356)]
[外链图片转存中...(img-mBarmmGq-1712750844356)]
[外链图片转存中...(img-UIbqnAqU-1712750844356)]
[外链图片转存中...(img-e5SEFwnc-1712750844357)]
**既有适合小白学习的零基础资料,也有适合3年以上经验的小伙伴深入学习提升的进阶课程,基本涵盖了95%以上Linux运维知识点,真正体系化!**
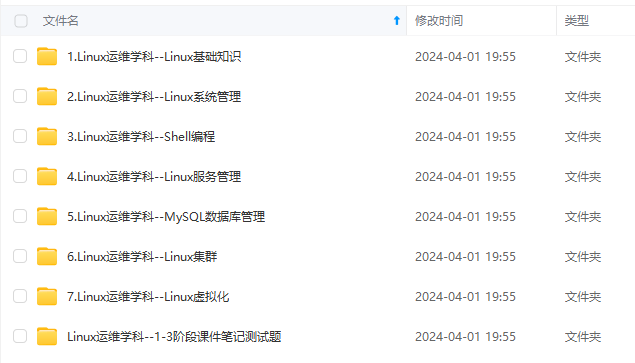
**由于文件比较大,这里只是将部分目录大纲截图出来,每个节点里面都包含大厂面经、学习笔记、源码讲义、实战项目、讲解视频,并且后续会持续更新**
**如果你觉得这些内容对你有帮助,可以添加VX:vip1024b (备注Linux运维获取)**
[外链图片转存中...(img-R2vHdbvg-1712750844357)]


 1490
1490


 被折叠的 条评论
为什么被折叠?
被折叠的 条评论
为什么被折叠?
 到【灌水乐园】发言


