


    source => "message"
    #删除无用字段,节约空间
    remove_field => "message"
    remove_field => "severity"
    remove_field => "pid"
    remove_field => "logsource"
    remove_field => "timestamp"
    remove_field => "facility_label"
    remove_field => "type"
    remove_field => "facility"
    remove_field => "@version"
    remove_field => "priority"
    remove_field => "severity_label"
}
date {
    #用nginx请求时间替换logstash生成的时间
    match => ["time_local", "ISO8601"]
    target => "@timestamp"
}
grok {
    #从时间中获取day
    match => { "time_local" => "(?<day>.{10})" }
}
grok {
    #将request解析成2个字段:method\url
    match => { "request" => "%{WORD:method} (?<url>.* )" }
}
grok {
    #截取http_referer问号前的部分,问号后的信息无价值,浪费空间
    match => { "http_referer" => "(?<referer>-|%{URIPROTO}://(?:%{USER}(?::[^@]*)?@)?(?:%{URIHOST})?)" }
}
mutate {
    #解析出新的字段后,原字段丢弃
    remove_field => "request"
    remove_field => "http_referer"
    rename => { "http_user_agent" => "agent" }
    rename => { "upstream_response_time" => "response_time" }
    rename => { "host" => "log_source" }
    rename => { "http_x_forwarded_for" => "x_forwarded_for" }
    #以下2个字段以逗号分隔后,以数组形式入库
    split => { "x_forwarded_for" => ", " }
    split => { "response_time" => ", " }
}
alter {
    #不满足elasticsearch索引模型的,入库会失败,因此做以下数据转换
    condrewrite => [
        "x_forwarded_for", "-", "0.0.0.0",
        "x_forwarded_for", "unknown", "0.0.0.0",
        "response_time", "-", "0",
        "real_ip", "", "0.0.0.0"
    ]
}
}
output {
#入库,以template指定的模型作为索引模型
elasticsearch {
hosts => [“elasticsearch_ip:9200”]
index => “nginx-%{day}”
manage_template => true
template_overwrite => true
template_name => “mynginx”
template => “/root/logstash/mynginxtemplate.json”
codec => json
}
#本地文件放一份,作为ELK的补充
file {
flush_interval => 600
path => ‘/nginxlog/%{day}/%{domain}.log’
codec => line { format => ‘<%{time_local}> <%{real_ip}> <%{method}> <%{url}> <%{status}> <%{request_time}> <%{response_time}> <%{body_bytes_sent}> <%{request_body}> <%{referer}> <%{x_f
orwarded_for}> <%{log_source}> <%{agent}>’}
}
}
mynginxtemplate.json
{
“template”: “nginx-*”,
“settings”: {
“index.number_of_shards”: 8,
“number_of_replicas”: 0,
“analysis”: {
“analyzer”: {
#自定义stop关键字,不收集http等字段的索引
“stop_url”: {
“type”: “stop”,
“stopwords”: [“http”,“https”,“www”,“com”,“cn”,“net”]
}
}
}
},
“mappings” : {
“doc” : {
“properties” : {
# index:true 分词、生产搜索引擎
# analyzer:指定索引分析器
“referer”: {
“type”: “text”,
“norms”: false,
“index”: true,
“analyzer”: “stop_url”
},
“agent”: {
“type”: “text”,
“norms”: false,
“index”: true
},
# IP字段类型
“real_ip”: {
“type”: “ip”
},
“x_forwarded_for”: {
“type”: “ip”
},
# keyword,作为完整字段索引,不可分词索引
“status”: {
“type”: “keyword”
},
“method”: {
“type”: “keyword”
},
“url”: {
“type”: “text”,
“norms”: false,
“index”: true,
“analyzer”: “stop_url”
},
“status”: {
“type”: “keyword”
},
“response_time”: {
“type”: “half_float”
},
“request_time”: {
“type”: “half_float”
},
“domain”: {
“type”: “keyword”
},
“project”: {
“type”: “keyword”
},
“request_body”: {
“type”: “text”,
“norms”: false,
“index”: true
},
“body_bytes_sent”: {
“type”: “long”
},
“log_source”: {
“type”: “ip”
},
“@timestamp” : {
“type” : “date”,
“format” : “dateOptionalTime”,
“doc_values” : true
},
“time_local”: {
“enabled”: false
},
“day”: {
“enabled”: false
}
}
}
}
}
### 5.elasticsearch配置


####


elasticsearch.yml
cluster.name: nginxelastic
节点名称,每个节点不同
node.name: node1
bootstrap.system_call_filter: false
bootstrap.memory_lock: true
本节点IP
network.host: 10.10.10.1
http.port: 9200
transport.tcp.port: 9300
单播自动发现,配置集群中其他节点的IP+端口,host1:port1,host2:port2,本例中只有2个节点,因此只配置另一个节点的IP和端口
discovery.zen.ping.unicast.hosts: [“other_node_ip:9300”]
一个节点需要看到的具有master节点资格的最小数量,推荐(N/2)+1
discovery.zen.minimum_master_nodes: 2
http.cors.enabled: true
http.cors.allow-origin: /.*/
path.data: /elastic/data
path.logs: /elastic/logs
jvm.options
jvm初始和最大内存,建议设置为服务器内存的一半
-Xms8g
-Xmx8g
crontab自动删除历史数据del\_index.sh
#!/bin/bash
DELINDEX=“nginx-“date -d "-30 day" +%Y-%m-%d
curl -H “Content-Type: application/json” -XDELETE ‘http://10.10.10.1:9200/’”${DELINDEX}”
### 6.kibana配置


####


kibana.yml
server.port: 80
server.host: 10.10.10.3
elasticsearch.url: “http://10.10.10.1:9200”
elasticsearch.username: “kibana”
elasticsearch.password: “mypwd”
界面设置:
management -> advanced settings:
dateFormat(日期格式):YYYYMMDD HH:mm:ss
defaultColumns(默认字段): method, url, status, request\_time, real\_ip
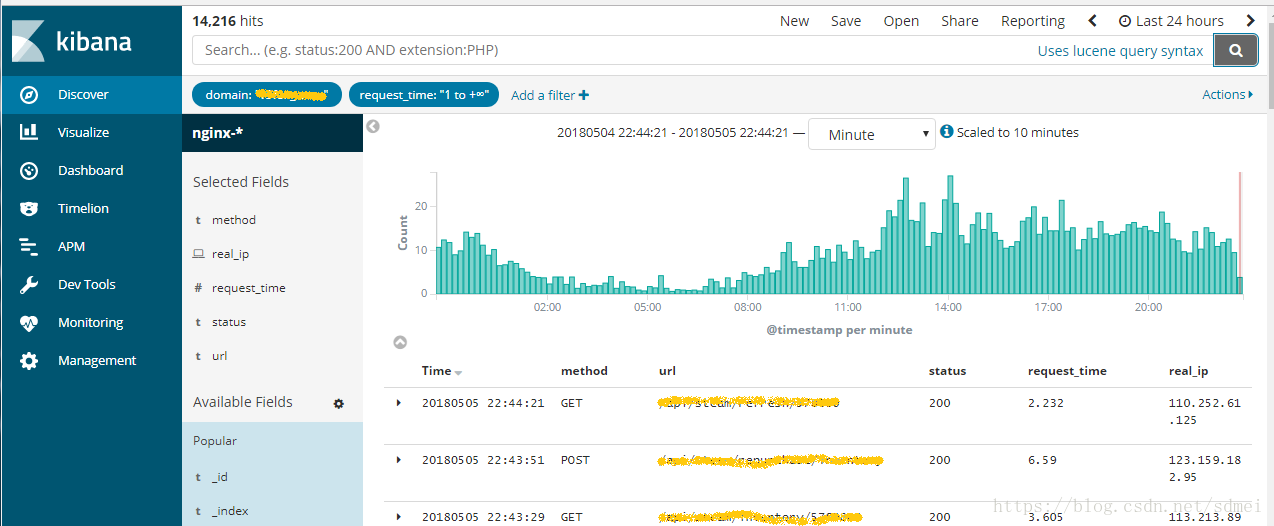
查询某域名下耗时超过1秒的请求
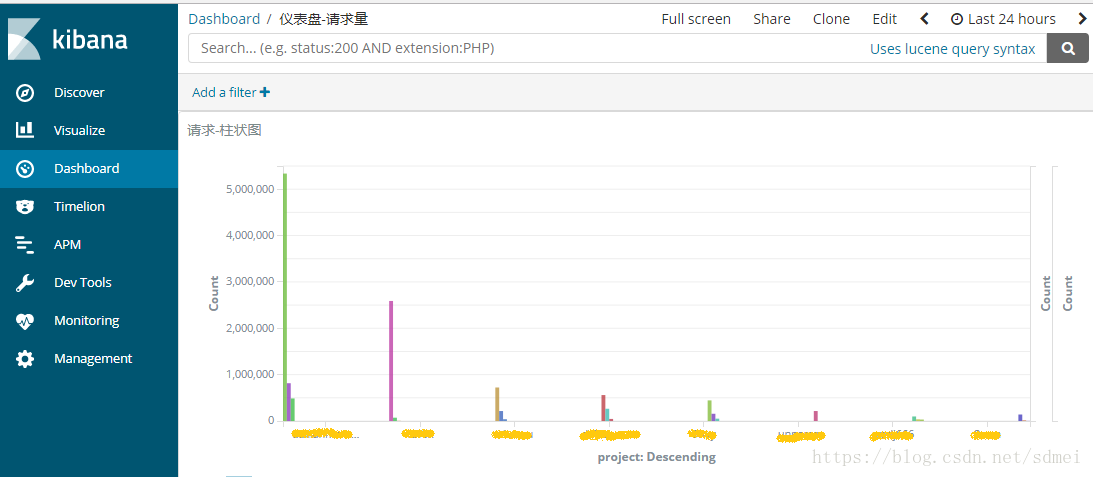
查询过去24小时各域名请流量柱状图
### 7.elastalert配置
官方有个watcher可用于实时监控ELK收集的日志,可惜是商业版的,想用免费的,elastalert是个不错的方案。
https://github.com/Yelp/elastalert
elastalert常用的监控类型有frequency\spike\等(http://elastalert.readthedocs.io/en/latest/ruletypes.html#rule-types)
* frequency: 监控特定事件出现的频率,如某IP每分钟请求超过600次,某域名每分钟出现30个以上耗时超过3秒的请求,某域名每分钟出现10个以上500状态的请求等。
* spike:监控事件出现的变化幅度,如最近1小时比上1小时请求增加了1倍,最近1天比上一天请求了减少了50%等等。
这里以frequency类型的监控为例,实时监控500状态错误。
config.yaml
指定es地址
es_host: 10.10.10.1
es_port: 9200
freq-500.yaml


#文件名自定义,容易区分即可
es_host: 10.10.10.1
es_port: 9200
name: elk-nginx-freq-500
type: frequency
index: nginx-*
周期内出现10次以上则报警
num_events: 10
周期1分钟
timeframe:
minutes: 1
查询条件
status in (500,501,502,503,504)
domain 不包含test,即测试域名下的事件忽略
filter:
- bool:
must:- terms:
status: [“500”,“501”,“502”,“503”,“504”]
must_not: - wildcard:
domain: “test”
- terms:
对每个domain单独计算num_events,最多计算10个domain,某个domain的num_events达到10个,才会报警
use_terms_query: true
doc_type: doc
terms_size: 10
query_key: domain
分别以domain和status列出top5的keys数量,报警邮件中提高top 5 domain和top 5 status
top_count_keys:
- domain
- status
top_count_number: 5
raw_count_keys: false
10分钟内不重复报警
realert:
minutes: 10
分别通过command(短信)和email报警
alert:
- command
自己写的调用短信接口的命令发生短信,短信内容比较简单,通知什么域名出现500状态报警
new_style_string_format: true
command: [“/root/elastalert-0.1.29/myalert/sms.sh”, “15800000000”, “elk nginx warning - freq 500 exceed, domain: {match[domain]}”]
以下是elastalert封装好的email报警配置
smtp_auth_file.yaml中配置邮件的用户名密码
smtp_host: smtp.exmail.qq.com
smtp_port: 465
smtp_ssl : true
from_addr: “elastalert@mydomain.com”
smtp_auth_file: “/root/elastalert-0.1.29/myalert/smtp_auth_file.yaml”
email:
- “myemail@mydomain.com”
alert_subject: “elk nginx warning - freq 500 exceed, domain: {0}”
alert_subject_args:
- domain
启动监控:

python -m elastalert.elastalert --verbose --rule freq-500.yaml >> freq-500.log 2>&1 & disown


 1580
1580

 被折叠的 条评论
为什么被折叠?
被折叠的 条评论
为什么被折叠?
 到【灌水乐园】发言


