


service grafana-server start
|
加入自启动
| 1 | |
sudo
update-rc.d grafana-server defaults
|
注:其他系统安装参考:http://docs.grafana.org/installation/
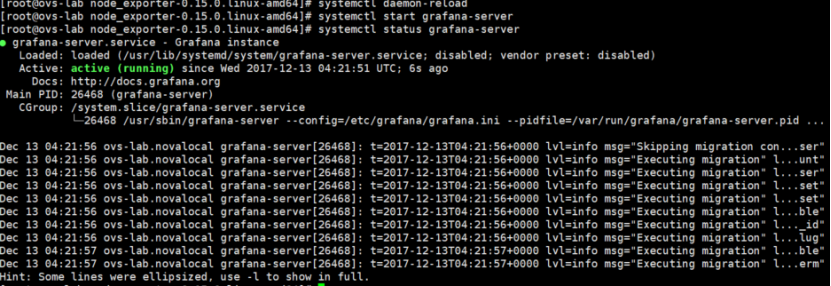
启动grafana并查看状态
systemctl daemon-reload
systemctl start grafana-serversystemctl status grafana-server
访问grafana, http://<服务器IP>:3000
默认用户名密码:admin/admin
为grafana添加Prometheus数据源
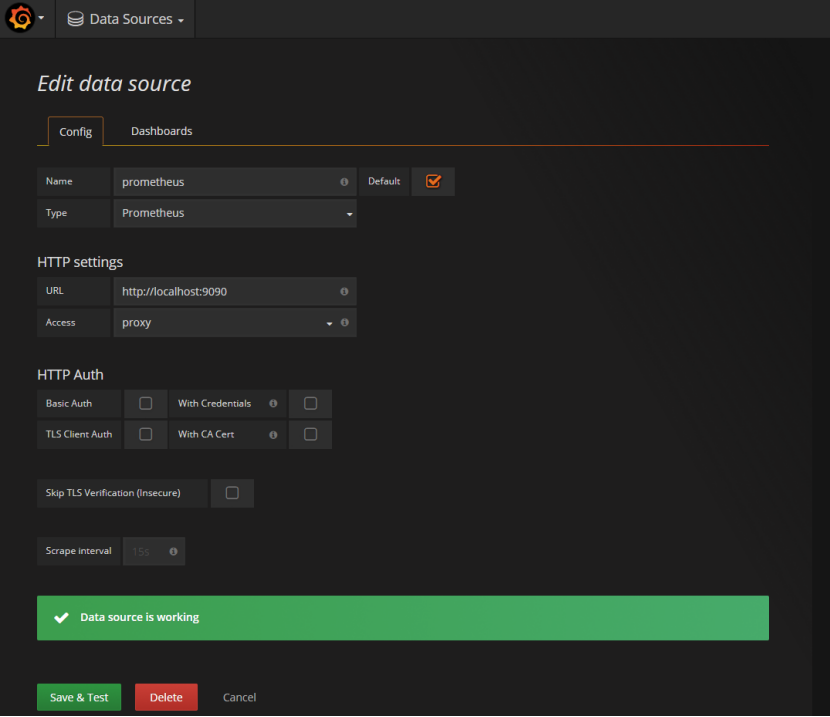
至此所有安装已完成
但是还存在以下问题
一:Prometheus server并没有配置被监控端的IP地址,即没有取指定的机器取数据
二:启动的方式太不人性化了,没有启动脚本。
三:grafana没有可用的dashboard用于展示
这些问题我们放在下面的配置,可视化段落处理。
配置
关闭之前之间运行的node_exporter及prometheus
增加一个被监控端配置项
创建目录/etc/prometheus/
| 1 | |
mkdir
/etc/prometheus/
|
创建配置文件
| 1 | |
vi
/etc/prometheus/prometheus
.yml
|
修改如下(在有配置文件基础上增加红色区域)
# my global configglobal:
  scrape_interval:     15s # Set the scrape interval to every 15 seconds. Default is every 1 minute.
  evaluation_interval: 15s # Evaluate rules every 15 seconds. The default is every 1 minute.
  # scrape_timeout is set to the global default (10s).

  # Attach these labels to any time series or alerts when communicating with
  # external systems (federation, remote storage, Alertmanager).
  external_labels:
      monitor: 'codelab-monitor'# Load rules once and periodically evaluate them according to the global 'evaluation_interval'.rule_files:  # - "first.rules"
  # - "second.rules"# A scrape configuration containing exactly one endpoint to scrape:# Here it's Prometheus itself.scrape_configs:  # The job name is added as a label `job=<job_name>` to any timeseries scraped from this config.
  - job_name: 'prometheus'

    # metrics_path defaults to '/metrics'
    # scheme defaults to 'http'.

    static_configs:
      - targets: ['localhost:9090']
注意:缩进是必须的
添加启动脚本
下载地址:https://github.com/youerning/blog/tree/master/prometheus
cp node-exporter.service /etc/init.d/node-exporter
cp prometheus.service /etc/init.d/prometheuschmod +x /etc/init.d/node-exporterchmod +x /etc/init.d/prometheus
将上面的可执行二进制文件移到/usr/local/bin
cp prometheus-2.0.0-rc.2.linux-amd64/prometheus /usr/local/bin/prometheus
mv node_exporter-0.15.0.linux-amd64/node_exporter /usr/local/bin/node_exporter
然后启动Prometheus,node-exporter
创建工作目录(Prometheus的数据会存在这,启动脚本里面我写的是/data)
mkdir /data
service prometheus startservice node-exporter start
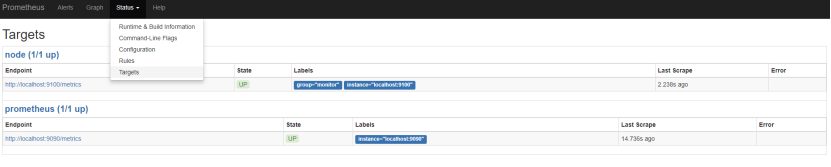
在Prometheus的web页面能看到被监控端
然后grafana导入dashboard
下载地址:https://grafana.com/dashboards/1860
注:https://grafana.com/dashboards还有很多的dashboard可以下载
按照以下步骤导入
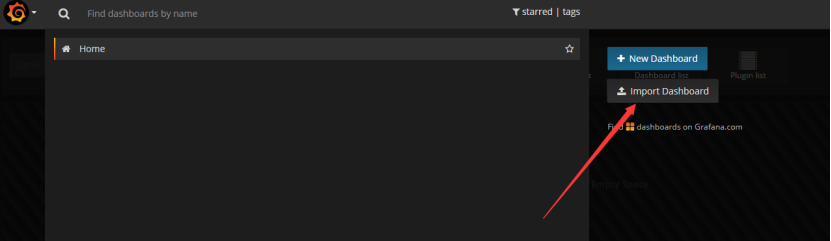
点击import以后grafana就会多一个dashboard
至此一个系统层面性能指标监控已经全部完成。
可视化自定义
由于grafana的界面配置都是页面点击,需要截图标注,如果截太多图就文章太冗长了,这里就不进一步说明了,相关配置参考
http://docs.grafana.org/features/panels/
通过上面的安装配置发现,其实整个监控的流程还缺少了报警的环节,如果不能及时通报异常情况再好看也白搭。
报警
解压
| 1 | |
tar
xf alertmanager-0.11.0.linux-amd64.
tar
.gz
|
规则配置
| 1 | |
cat
/etc/prometheus/alert
.rules
|
groups:
- name: uptime
rules:
Alert for any instance that is unreachable for >1 minutes.
-
- alert: InstanceDown
expr: up == 0
for: 1m
labels:
severity: page
annotations:
summary: “Instance {{ $labels.instance }} down”
description: “{{ $labels.instance }} of job {{ $labels.job }} has been down for more than 5 minutes.”
- alert: InstanceDown
prometheus.yml增加以下内容
- | | |
| — | — |
|
1
|
<br data-filtered=
"filtered"
>
|
| 1 |
2
3
4
5
6
7
8
9
|
rule_files:
-
"/etc/prometheus/alert.rules"
alerting:
alertmanagers:
- scheme: http
static_configs:
- targets:
-
"localhost:9093"
|
详细配置参考: https://github.com/youerning/blog/blob/master/prometheus/prometheus-alertmanager.yml
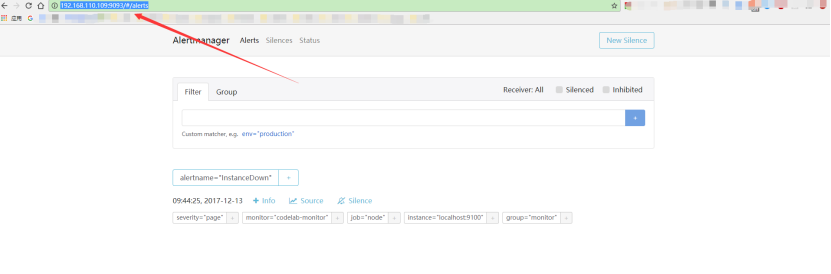
启动alertmanager
| 1 | |
.
/alertmanager
--config.
file
=
/etc/prometheus/alertmanager
.yml
|
查看监控状态
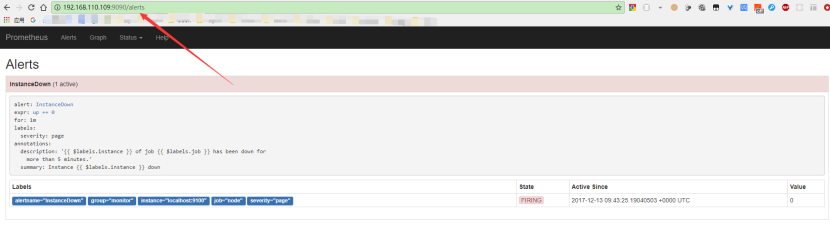
不过Prometheus的报警操作真的很扯淡。
支持的接受操作如下
<email_config>
<hipchat_config>
<pagerduty_config>
<pushover_config>
<slack_config>
<opsgenie_config>
<victorops_config>
<webhook_config>
而email报警有个扯淡的地方就是如果邮件服务器必须tls认证且ssl是自签名的话就会starttls failed: x509: certificate signed by unknown authority
而且没有一个in_secure:true的选项。
所以需要邮件报警的话有两种方法,
一:再报警服务器里面植入自己的证书,
参考:http://blog.amigapallo.org/2016/04/14/alertmanager-docker-container-self-signed-smtp-server-certificate/
二:允许smtp不使用tls
其实上面两种方法都不太优雅,观法推荐的是使用web_hook
但是又得保证web_hook的服务是运行的,这就很扯淡了,不过,如果是全部跑在docker管理平台,如k8s,倒是不错的。
下面是一个简单的实现。
| 1 |
2
3
4
5
6
7
8
9
10
11
12
13
14
15
16
17
18
19
20
21
22
23
24
25
26
27
28
29
30
31
32
33
34
35
36
37
38
39
40
41
|
from
__future__
import
print_function
import
falcon
from
wsgiref
import
simple_server
from
email.mime.text
import
MIMEText
import
smtplib
import
json
smtpServer
=
"mx.example.com"
smtpUser
=
"sender@example.com"
smtpPass
=
"password"
sender
=
"sender@example.com"
reciver
=
"reciver@example.com"
tpl
=
"""
status: {status}
alerts: {alerts}
"""
def
sendMail(reciver, subject, message):
server
=
smtplib.SMTP(smtpServer,
587
)
server.ehlo()
server.starttls()
server.ehlo()
server.login(smtpUser, smtpPass)
server.set_debuglevel(
1
)
msg
=
MIMEText(message,
"plain"
,
"utf8"
)
msg[
"Subject"
]
=
subject
server.sendmail(sender, [reciver], msg.as_string())
server.quit()
class
WebHook(
object
):
def
on_post(
self
, req, resp):
"""Handles GET requests"""
body
=
req.stream.read()
postData
=
json.loads(body.decode(
'utf-8'
))
msg
=
tpl.
format
(
*
*
postData)
print
(msg)
sendMail(reciver,
"alert"
, msg)
resp.status
=
falcon.HTTP_200
# This is the default status
resp.body
=
"OK"
app
=
falcon.API()
app.add_route(
'/'
, WebHook())
if
__name__
=
=
'__main__'
:
httpd
=
simple_server.make_server(
'0.0.0.0'
,
80
, app)
httpd.serve_forever()
|
源码:https://github.com/youerning/blog/blob/master/prometheus/webhookmail.py
注意:有falcon的依赖,需要pip install falcon
效果如下
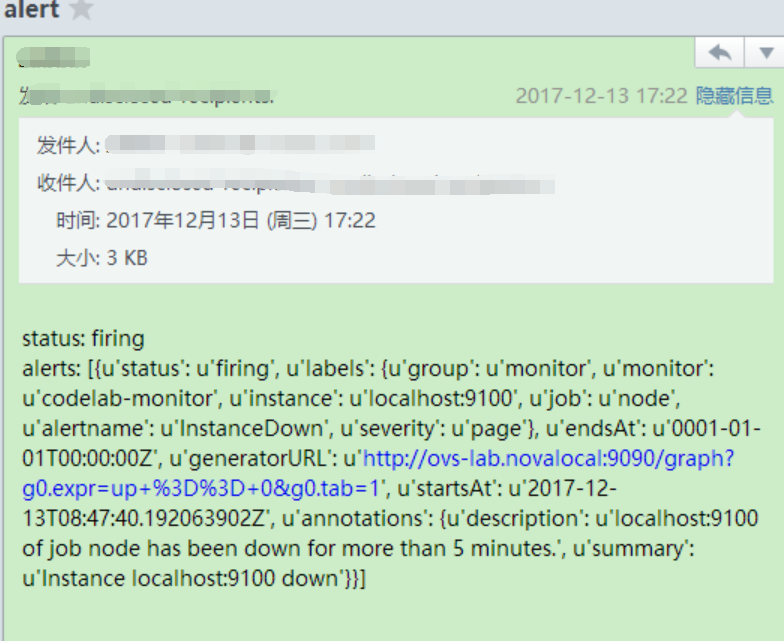
注:由于我没有进一步处理post过来的json数据,所以显得不是很直观,大家可以根据自己的需要编排数据
其他exporter
除了基本的node_exporter,Prometheus官方还提供其他的exporter,如mysql, memcache,haproxy等
除了官方提供的,也还有很多第三方的expoter,参考:https://prometheus.io/docs/instrumenting/exporters/
自定义exporter
本文太长了, 直接看官方example吧。
参考:https://github.com/prometheus/client_golang/blob/master/examples/random/main.go
既有适合小白学习的零基础资料,也有适合3年以上经验的小伙伴深入学习提升的进阶课程,涵盖了95%以上软件测试知识点,真正体系化!
’ :`
httpd
=
simple_server.make_server(
'0.0.0.0'
,
80
, app)
httpd.serve_forever()
|
源码:https://github.com/youerning/blog/blob/master/prometheus/webhookmail.py
注意:有falcon的依赖,需要pip install falcon
效果如下
[外链图片转存中…(img-NVCoaSl2-1719253060069)]
注:由于我没有进一步处理post过来的json数据,所以显得不是很直观,大家可以根据自己的需要编排数据
其他exporter
除了基本的node_exporter,Prometheus官方还提供其他的exporter,如mysql, memcache,haproxy等
除了官方提供的,也还有很多第三方的expoter,参考:https://prometheus.io/docs/instrumenting/exporters/
自定义exporter
本文太长了, 直接看官方example吧。
参考:https://github.com/prometheus/client_golang/blob/master/examples/random/main.go
[外链图片转存中…(img-NX0CbvKc-1719253060069)]
[外链图片转存中…(img-U7drXlSi-1719253060070)]
[外链图片转存中…(img-XNuHoI1A-1719253060070)]
既有适合小白学习的零基础资料,也有适合3年以上经验的小伙伴深入学习提升的进阶课程,涵盖了95%以上软件测试知识点,真正体系化!


 383
383

 被折叠的 条评论
为什么被折叠?
被折叠的 条评论
为什么被折叠?
 到【灌水乐园】发言


