


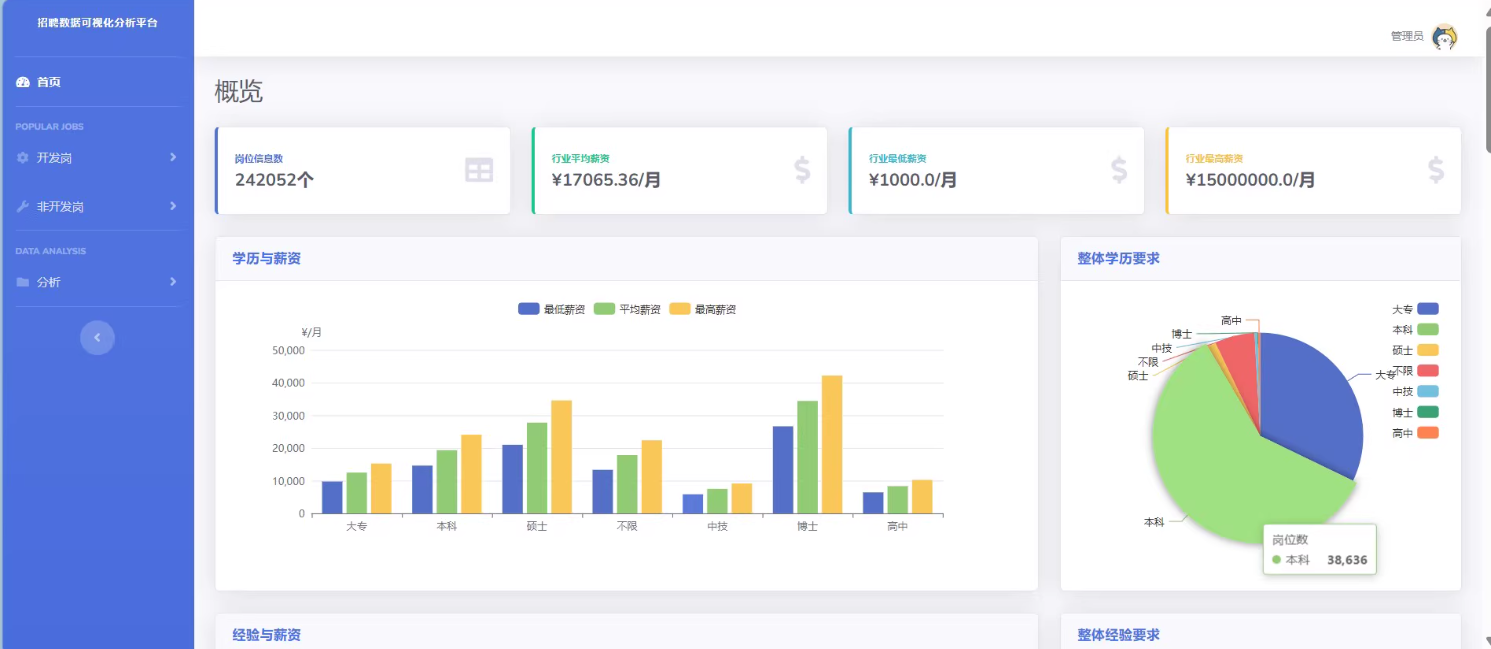
基于Python实现招聘岗位信息数据分析平台
Python实现招聘岗位信息数据分析平台(数据集+源码+PPT+论文)
技术:numpy、pandas、flask、echarts
源码+PPT+论文(字数9k左右)
2024招聘岗位信息数据分析平台
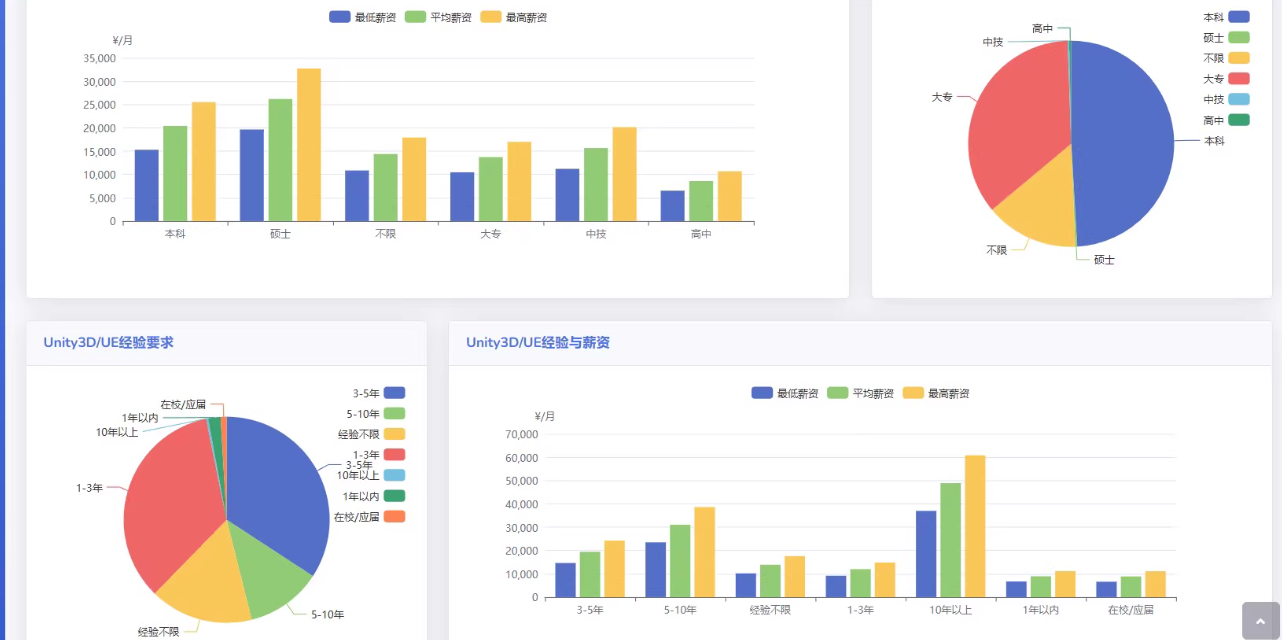
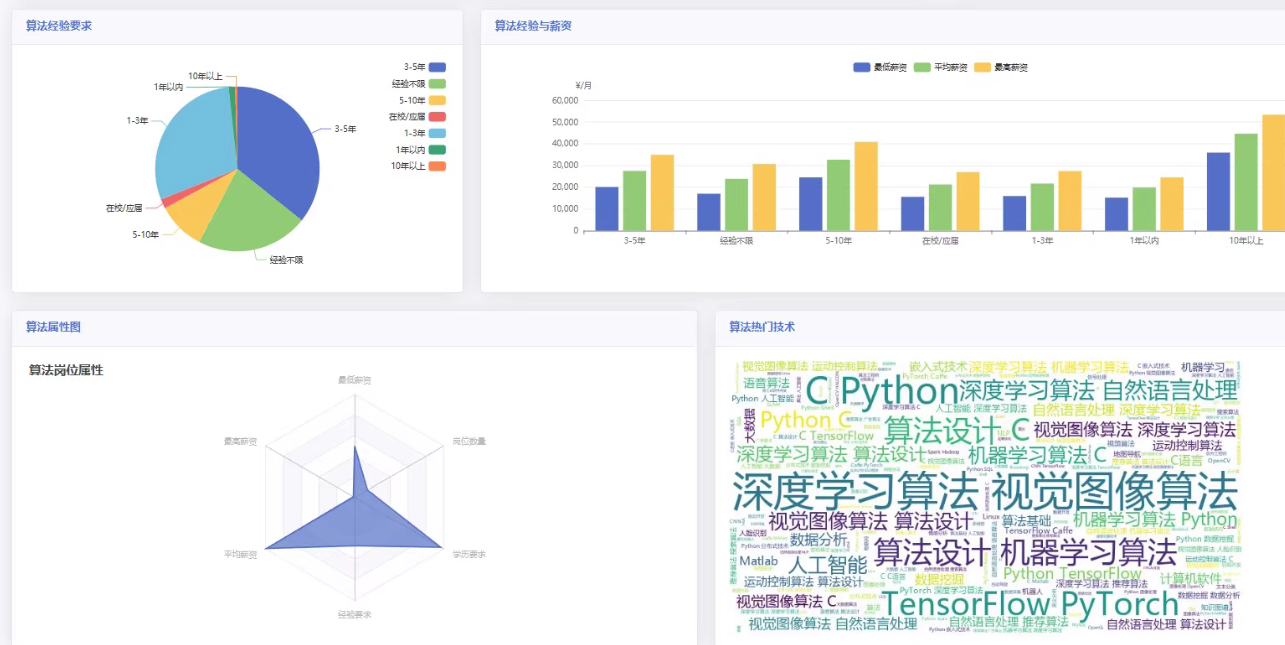
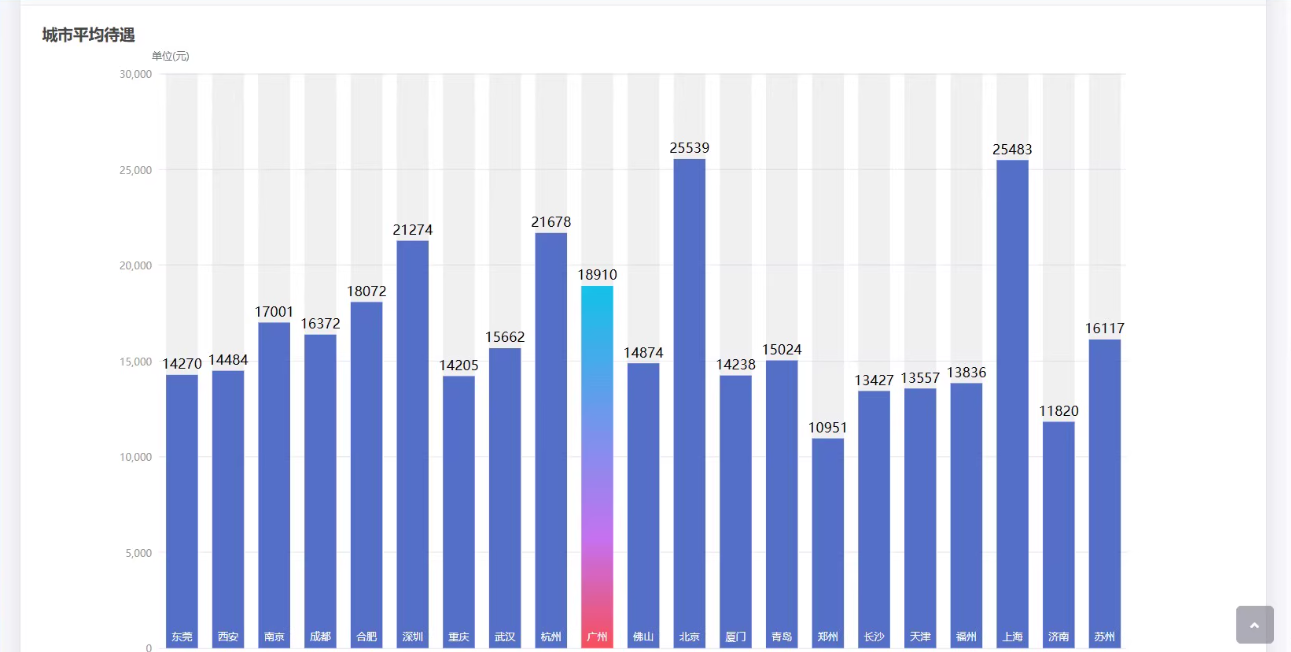
数据分析可视化项目–基于Python实现招聘岗位信息数据分析平台
项目关键步骤:
数据清洗,数据预处理,数据统计,数据可视化,研究结论(数据集来源于BOSS直聘平台)
项目背景与意义:
各大招聘网站已经发展很成熟,既为广大求职者提供了向全国各地各大企业推荐自己的机会,又向各大企业不断输入着优质员工。新冠疫情的出现加速了线上活动的开展,在线招聘模式越来越适用于日常生活中。
对于每年日益增多的就业大军而言,可以从该系统中清楚了解到互联网各行业现状,同时结合数学公式通过选择职位、公司规模、工作经验、学历、期望城市等信息来预测最低薪资,选有助于做出适合自身情况的选择。
以下是一个基于 Python 实现的招聘岗位信息数据分析平台的设计和代码示例。该平台将从招聘网站(如前程无忧、智联招聘等)抓取数据,并进行清洗、分析和可视化。
1. 环境准备
确保安装了以下工具和库:
- Python 3.x
pandas(pip install pandas)requests和BeautifulSoup(pip install requests beautifulsoup4)matplotlib和seaborn(pip install matplotlib seaborn)jupyter(可选,用于交互式分析)
2. 数据采集模块
使用 requests 和 BeautifulSoup 抓取招聘信息。以下以模拟抓取某招聘网站为例:
import requests
from bs4 import BeautifulSoup
import pandas as pd

# 模拟抓取招聘网站数据
def fetch_job_data(url):
    headers = {
        "User-Agent": "Mozilla/5.0 (Windows NT 10.0; Win64; x64) AppleWebKit/537.36 (KHTML, like Gecko) Chrome/114.0.0.0 Safari/537.36"
    }
    response = requests.get(url, headers=headers)
    soup = BeautifulSoup(response.text, 'html.parser')

    jobs = []
    for item in soup.find_all('div', class_='job-item'):
        title = item.find('h3').text.strip()
        company = item.find('span', class_='company-name').text.strip()
        location = item.find('span', class_='location').text.strip()
        salary = item.find('span', class_='salary').text.strip()
        experience = item.find('span', class_='experience').text.strip()
        jobs.append({
            'title': title,
            'company': company,
            'location': location,
            'salary': salary,
            'experience': experience
        })
    return jobs

# 示例 URL(请替换为实际目标网站)
url = "https://example.com/jobs"
data = fetch_job_data(url)

# 转换为 DataFrame
df = pd.DataFrame(data)
print(df.head())
—
3. 数据清洗模块
对抓取的数据进行清洗和标准化处理:
import re

# 清洗薪资字段
def clean_salary(salary):
    match = re.search(r'(\d+)[kK]', salary)
    if match:
        return int(match.group(1)) * 1000
    return None

# 清洗工作经验字段
def clean_experience(experience):
    match = re.search(r'(\d+)-(\d+)', experience)
    if match:
        return (int(match.group(1)) + int(match.group(2))) // 2
    return None

# 数据清洗
df['salary'] = df['salary'].apply(clean_salary)
df['experience'] = df['experience'].apply(clean_experience)
df.dropna(inplace=True)  # 删除缺失值
print(df.head())
4. 数据分析模块
对清洗后的数据进行统计分析:
import matplotlib.pyplot as plt
import seaborn as sns

# 统计职位数量分布
job_count = df['title'].value_counts()[:10]
plt.figure(figsize=(10, 6))
sns.barplot(x=job_count.index, y=job_count.values)
plt.title('Top 10 Job Titles')
plt.xlabel('Job Title')
plt.ylabel('Count')
plt.xticks(rotation=45)
plt.show()

# 统计薪资分布
plt.figure(figsize=(10, 6))
sns.histplot(df['salary'], bins=20, kde=True)
plt.title('Salary Distribution')
plt.xlabel('Salary')
plt.ylabel('Frequency')
plt.show()

# 统计工作经验与薪资的关系
plt.figure(figsize=(10, 6))
sns.scatterplot(data=df, x='experience', y='salary')
plt.title('Experience vs Salary')
plt.xlabel('Experience (Years)')
plt.ylabel('Salary')
plt.show()
5. 数据存储模块
将清洗后的数据保存到文件或数据库中:
# 保存为 CSV 文件
df.to_csv('job_data.csv', index=False)

# 保存到 MySQL 数据库
import mysql.connector

conn = mysql.connector.connect(
    host="localhost",
    user="root",
    password="your_password",
    database="job_analysis"
)
cursor = conn.cursor()

# 创建表
cursor.execute("""
CREATE TABLE IF NOT EXISTS jobs (
    id INT AUTO_INCREMENT PRIMARY KEY,
    title VARCHAR(255),
    company VARCHAR(255),
    location VARCHAR(255),
    salary INT,
    experience INT
)
""")

# 插入数据
for _, row in df.iterrows():
    cursor.execute("""
    INSERT INTO jobs (title, company, location, salary, experience)
    VALUES (%s, %s, %s, %s, %s)
    """, (row['title'], row['company'], row['location'], row['salary'], row['experience']))

conn.commit()
cursor.close()
conn.close()
6. 完整流程整合
以下是完整的主程序代码:
import requests
from bs4 import BeautifulSoup
import pandas as pd
import re
import matplotlib.pyplot as plt
import seaborn as sns
import mysql.connector

# 数据采集
def fetch_job_data(url):
    headers = {"User-Agent": "Mozilla/5.0"}
    response = requests.get(url, headers=headers)
    soup = BeautifulSoup(response.text, 'html.parser')

    jobs = []
    for item in soup.find_all('div', class_='job-item'):
        title = item.find('h3').text.strip()
        company = item.find('span', class_='company-name').text.strip()
        location = item.find('span', class_='location').text.strip()
        salary = item.find('span', class_='salary').text.strip()
        experience = item.find('span', class_='experience').text.strip()
        jobs.append({
            'title': title,
            'company': company,
            'location': location,
            'salary': salary,
            'experience': experience
        })
    return jobs

# 数据清洗
def clean_data(df):
    df['salary'] = df['salary'].apply(lambda x: int(re.search(r'(\d+)[kK]', x).group(1)) * 1000 if re.search(r'(\d+)[kK]', x) else None)
    df['experience'] = df['experience'].apply(lambda x: (int(re.search(r'(\d+)-(\d+)', x).group(1)) + int(re.search(r'(\d+)-(\d+)', x).group(2))) // 2 if re.search(r'(\d+)-(\d+)', x) else None)
    df.dropna(inplace=True)
    return df

# 数据分析
def analyze_data(df):
    # 职位数量分布
    job_count = df['title'].value_counts()[:10]
    plt.figure(figsize=(10, 6))
    sns.barplot(x=job_count.index, y=job_count.values)
    plt.title('Top 10 Job Titles')
    plt.xlabel('Job Title')
    plt.ylabel('Count')
    plt.xticks(rotation=45)
    plt.show()

    # 薪资分布
    plt.figure(figsize=(10, 6))
    sns.histplot(df['salary'], bins=20, kde=True)
    plt.title('Salary Distribution')
    plt.xlabel('Salary')
    plt.ylabel('Frequency')
    plt.show()

# 主程序
if __name__ == "__main__":
    url = "https://example.com/jobs"  # 替换为目标网站
    data = fetch_job_data(url)
    df = pd.DataFrame(data)
    df = clean_data(df)
    analyze_data(df)
    df.to_csv('job_data.csv', index=False)
7. 运行项目
运行主程序后,系统会抓取招聘数据并生成分析结果和图表。


 被折叠的 条评论
为什么被折叠?
被折叠的 条评论
为什么被折叠?
 到【灌水乐园】发言


