


DAY 14
SHAP图介绍
参考帖子:SHAP 可视化解释机器学习模型简介_shap图-CSDN博客
今日作业偏思考类型,有一定难度
- 参考上述文档补全剩余的几个图
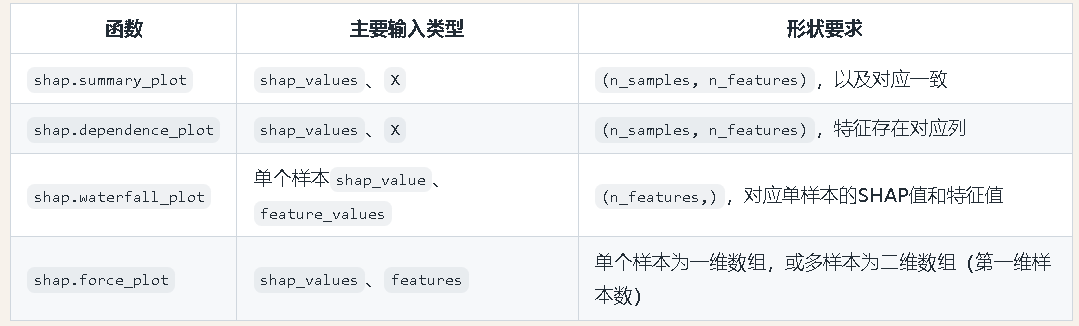
- 尝试确定一下shap各个绘图函数对于每一个参数的尺寸要求,如shap.force_plot力图中的数据需要满足什么形状?
- 确定分类问题和回归问题的数据如何才能满足尺寸,分类采取信贷数据集,回归采取单车数据集。
import pandas as pd
import numpy as np
import matplotlib.pyplot as plt
import seaborn as sns
import warnings
warnings.filterwarnings("ignore")

plt.rcParams['font.sans-serif'] = ['SimHei']  # Windows系统常用黑体字体
plt.rcParams['axes.unicode_minus'] = False    # 正常显示负号
dt = pd.read_csv(r'data.csv')
dt.info()
dt.head()

discrete_features = dt.select_dtypes(include=['object']).columns.tolist()
continuous_features = dt.select_dtypes(include=['float64','int64']).columns.tolist()
for i in discrete_features:
    mode_value = dt[i].mode()[0]
    dt[i].fillna(mode_value,inplace=True)
    print(f"列'{i}'用众数'{mode_value}'补全缺失值")
for j in continuous_features:
    median_value = dt[j].median()
    dt[j].fillna(median_value,inplace=True)
    print(f"列'{j}'用中位数'{median_value}'补全缺失值")
dt.head(10)

mapping = {
    'Home Ownership': {
        'Own Home': 0,
        'Rent': 1,
        'Have Mortgage': 2,
        'Home Mortgage': 3
    },
    'Term': {
        'Short Term': 0,
        'Long Term': 1
    },
    'Purpose': {
        'debt_consolidation': 2,
        'buy house': 1,
        'business loan': 1,
        'major purchase': 1,
        'small business': 1,
        'other': 0,
        'home improvements': 0,
        'buy a car': 0,
        'medical bills': 0,
        'take a trip': 0,
        'wedding': 0,
        'moving': 0,
        'educational eXpenses': 0,
        'vacation': 0,
        'renewable energy': 0
    },
    'Years in current job': {
        '10+ years': 0,
        '9 years': 1,
        '8 years': 1,
        '7 years': 2,
        '6 years': 2,
        '5 years': 3,
        '4 years': 3,
        '3 years': 4,
        '2 years': 4,
        '1 year' : 5,
        '< 1 year': 5
    }
}

dt["Home Ownership"] = dt["Home Ownership"].map(mapping["Home Ownership"])
dt["Term"] = dt["Term"].map(mapping["Term"])
dt["Purpose"] = dt["Purpose"].map(mapping["Purpose"])
dt["Years in current job"] = dt["Years in current job"].map(mapping["Years in current job"])
dt.rename(columns={'Term': 'Long Term'}, inplace=True)

process_data = ['Annual Income','Tax Liens','Number of Open Accounts','Years of Credit History','Maximum Open Credit','Number of Credit Problems','Months since last delinquent','Bankruptcies','Current Loan Amount','Current Credit Balance','Monthly Debt','Credit Score' ]
for i in process_data:
    dt[i] = (dt[i] - dt[i].min()) / (dt[i].max() - dt[i].min())
dt.head(10)

#删除一列特征
dt.drop(columns=['Id','Purpose'], inplace=True)
dt.head(10)

from sklearn.model_selection import train_test_split
X = dt.drop(['Credit Default'], axis=1)
y = dt['Credit Default']
X_train, X_test, y_train, y_test = train_test_split(X, y, test_size=0.2, random_state=42)
print(f"训练集形状: {X_train.shape}, 测试集形状: {X_test.shape}")

from sklearn.ensemble import RandomForestClassifier
from sklearn.metrics import accuracy_score, precision_score, recall_score, f1_score
from sklearn.metrics import classification_report, confusion_matrix
import warnings
warnings.filterwarnings("ignore")
import time

print("--- 1. 默认参数随机森林 (训练集 -> 测试集) ---")
start_time = time.time()
rf = RandomForestClassifier(random_state=42)
rf.fit(X_train,y_train)
rf_pred = rf.predict(X_test)
end_time = time.time()
print(f"训练时间: {end_time - start_time:.4f} 秒")
print("\n默认随机森林 在测试集上的分类报告:")
print(classification_report(y_test, rf_pred))
print("默认随机森林 在测试集上的混淆矩阵:")
print(confusion_matrix(y_test, rf_pred))
print(f"准确率: {accuracy_score(y_test, rf_pred):.4f}")
print(f"精确率: {precision_score(y_test, rf_pred):.4f}")

import shap
import matplotlib.pyplot as plt
explainer = shap.TreeExplainer(rf)
shap_values = explainer.shap_values(X_test)
import numpy as np
shap_values2 = np.array(shap_values)
print(shap_values2.shape)
shap_values2.shape

print("shap_values shape:", shap_values2.shape)
print("shap_values[0] shape:", shap_values2[0].shape)
print("shap_values[0, :, :] shape:", shap_values2[0, :, :].shape)
print("X_test shape:", X_test.shape)

# --- 1. SHAP 特征重要性条形图 (Summary Plot - Bar) ---
print("--- 1. SHAP 特征重要性条形图 ---")
shap.summary_plot(shap_values2[0], X_test, plot_type="bar",show=False)
plt.title('SHAP 特征重要性条形图')
plt.show()

# --- 2. SHAP 特征重要性 violin 图 (Summary Plot - violin) ---
print("--- 2. SHAP 特征重要性 violin 图 ---")
shap.summary_plot(shap_values2[0], X_test, plot_type="violin",show=False)
plt.title('SHAP 特征重要性 violin 图')
plt.show()

shap_values3 = explainer(X_test)
shap_values3.shape
print("shap_values shape:", shap_values3.shape)
print("shap_values[0] shape:", shap_values3[0].shape)
print("shap_values[0, :, :] shape:", shap_values3[:, :, 0].shape)
print("X_test shape:", X_test.shape)
#全局条形图
shap.plots.bar(shap_values3[:, :, 0], show=False)
plt.title('全局条形图')
plt.show()
#局部条形图
shap.plots.bar(shap_values3[0,:,0], show=False)
plt.title('局部条形图')
plt.show()
#队列条形图
term = ["short term" if X_test.iloc[i]["Long Term"] == 0
        else "long term" for i in range(X_test.shape[0])]
shap.plots.bar(shap_values3[:,:,0].cohorts(term).abs.mean(0))
plt.show()
#自动分组
v = shap_values3[:,:,0].cohorts(2).abs.mean(0)
shap.plots.bar(v)

clustering = shap.utils.hclust(X, y)
shap.plots.bar(shap_values3[:,:,0],
            clustering=clustering,
            clustering_cutoff=0.5)
shap.summary_plot(shap_values, X)
shap.plots.beeswarm(shap_values3[:,:,0],
                    order=shap_values3[:,:,0].abs.max(0))


shap.dependence_plot(
    'Current Loan Amount',
    shap_values3.values[:, :, 0],  # Access SHAP values array from Explanation object
    features=X_test,
    interaction_index='Credit Score'
)
shap_interaction_values = explainer.shap_interaction_values(X_test)
shap.summary_plot(shap_interaction_values, X_test, show=False)

expected_value = explainer.expected_value
# 限制20个样本
features = X_test.iloc[range(20)]
# 展示第一条样本
shap_values = explainer.shap_values(features)[1]
shap.decision_plot(expected_value, shap_values,features_display)

shap_values = explainer.shap_values(features)
y_pred = (shap_values.sum(1) + expected_value) > 0
misclassified = y_pred != y[select]
shap.decision_plot(expected_value, shap_values,
                features_display,
                link='logit',
                highlight=misclassified)

shap_values = explainer.shap_values(features)
shap.decision_plot(expected_value, shap_values, features_display, link='identity')


 274
274

 被折叠的 条评论
为什么被折叠?
被折叠的 条评论
为什么被折叠?
 到【灌水乐园】发言


