


01 Prometheus 监控平台部署
Linux 操作系统监控 + Mysql 监控
1、平台监控原理:
环境说明:
本文档中各组件运行的环境为 Ubuntu(64 位操作系统)
node_exporter 监控的是 192.168.1.26 机器的操作系统
mysql_exporter 监控的是 192.168.1.30 上安装的 MySQL 数据库
Grafana+Prometheus 部署在 192.168.1.33 机器
部署前的准备:
-
关闭所有 Linux 机器的防火墙:
systemctl stop firewalld.service -
保证所有 Linux 机器的时间是准确的,执行 date 命令检查;如果不准确,建议使用ntp 同步最新网络时间
02 部署 Linux 操作系统监控组件
1、下载监控 Linux 的 exporter
https://github.com/prometheus/node_exporter/releases/download/v0.18.1/node_exporter-0.18.1.linux-amd64.tar.gz
2、将 node_exporter 包上传到需要被监控的 Linux 服务器上任意目录下,执行解压命令
tar xvf node_exporter-0.18.1.linux-amd64.tar.gz
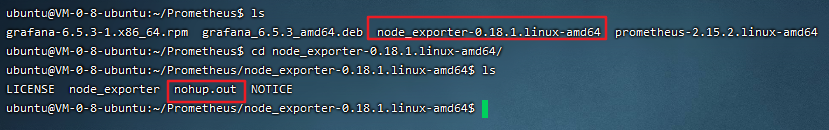
3、进入到解压后的文件夹中,执行启动脚本node_exporter-0.18.1.linux-amd64nohup ./node_exporter &
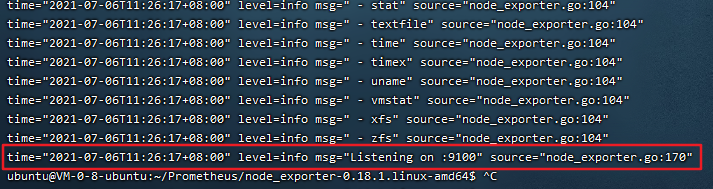
4、查看 nohup 日志,出现如下日志,代表启动成功tail -100 nohup.out
03 部署prometheus
1、下载包
https://github.com/prometheus/prometheus/releases/download/v2.15.2/prometheus-2.15.2.linux-amd64.tar.gz
2、将 prometheus 上传到一台单独的 Linux 机器上,执行解压操作
ubuntu@VM-0-8-ubuntu:~$ lsapp logs Project Prometheus README.txt tools VueProjectubuntu@VM-0-8-ubuntu:~$ cd Prometheus/ubuntu@VM-0-8-ubuntu:~/Prometheus$ tar -xvf prometheus-2.15.2.linux-amd64.tar.gzubuntu@VM-0-8-ubuntu:~/Prometheus$ lsgrafana_6.5.3_amd64.deb node_exporter-0.18.1.linux-amd64 prometheus-2.15.2.linux-amd64ubuntu@VM-0-8-ubuntu:~/Prometheus$ cd prometheus-2.15.2.linux-amd64/ubuntu@VM-0-8-ubuntu:~/Prometheus/prometheus-2.15.2.linux-amd64$ lsconsole_libraries consoles data LICENSE nohup.out NOTICE prometheus prometheus.yml promtool tsdb3、进入到解压后的文件夹中,修改配置文件,添加要监控的服务器信息 192.168.1.26vi prometheus.yml
4、在 scrape_configs 配置项下添加 Linux 监控的 job,其中IP 修改为上面部署 node_exporter 机器的 ip,端口号为 9100,注意缩进
# my global config

global:

  scrape_interval:     2s # Set the scrape interval to every 15 seconds. Default is every 1 minute.

  evaluation_interval: 2s # Evaluate rules every 15 seconds. The default is every 1 minute.

  # scrape_timeout is set to the global default (10s).


# Alertmanager configuration

alerting:

  alertmanagers:

  - static_configs:

    - targets:

      # - alertmanager:9093


# Load rules once and periodically evaluate them according to the global 'evaluation_interval'.

rule_files:

  # - "first_rules.yml"

  # - "second_rules.yml"


# A scrape configuration containing exactly one endpoint to scrape:

# Here it's Prometheus itself.

scrape_configs:

  # The job name is added as a label `job=<job_name>` to any timeseries scraped from this config.

  - job_name: 'prometheus'


    # metrics_path defaults to '/metrics'

    # scheme defaults to 'http'.


    static_configs:

    - targets: ['localhost:9090']

  - job_name: 'node'

    static_configs:


  # 新增的服务器配置信息

  - job_name: 'node'

    static_configs:

- targets: ['192.168.1.26:9100']5、保存配置文件,启动 prometheusnohup ./prometheus &
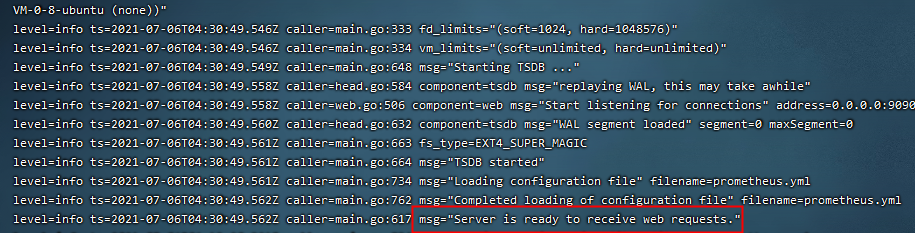
6、检查 nohup.out 日志,如果有以下信息,启动成功vi nohup.out
通过反斜杠 '/Server is ready to receive' 回车查询
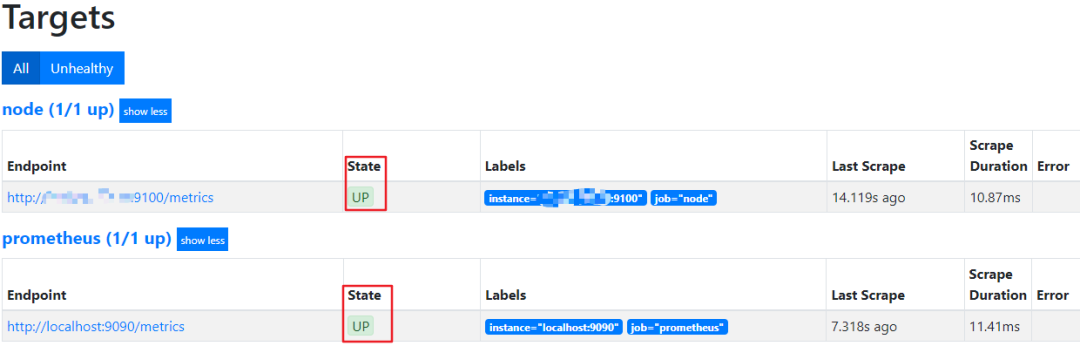
7、在浏览器中访问部署的 prometheus:http://192.168.1.33:9090
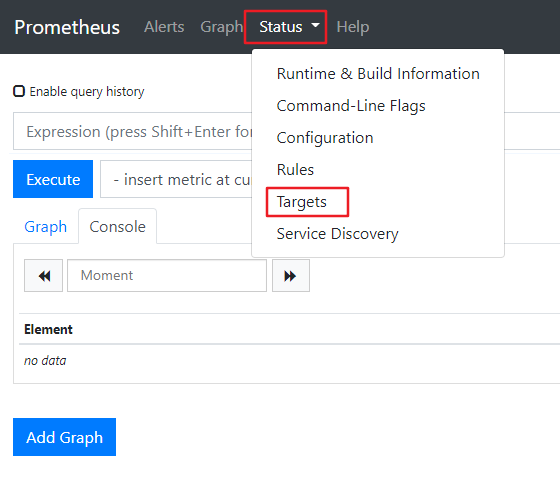
8、点击菜单栏“Status-Targets”,看到页面中有如下 node 节点,代表 prometheus 和node_exporter 链接成功
04 部署 Grafana
1、下载安装grafana(建议使用8.0.6版本,6.5.3有不兼容问题)
sudo apt-get install -y adduser libfontconfig1
wget https://dl.grafana.com/oss/release/grafana_6.5.3_amd64.deb
sudo dpkg -i grafana_6.5.3_amd64.deb
![]()
2、启动 grafanasystemctl start grafana-server
3、在浏览器访问:http://192.168.1.33:3000/
输入用户名/密码:admin/admin 登录

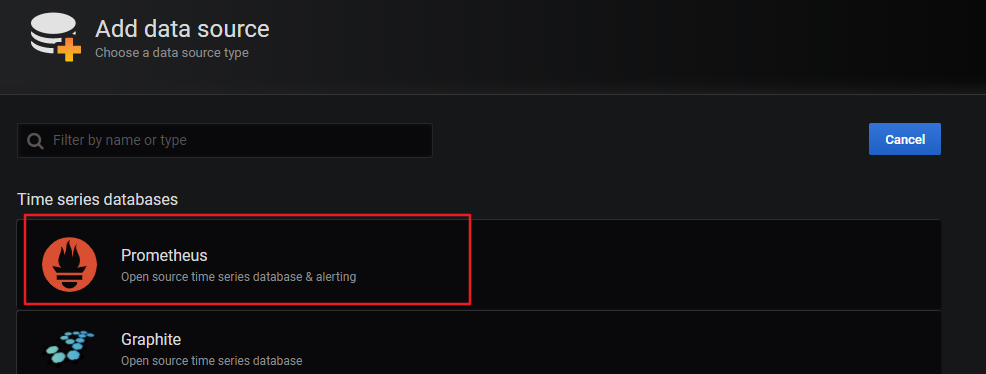
4、添加数据源,选择 prometheus
5、进行数据源配置,因为我的 prometheus 和 grafana 装在同一台机器上,所以 ip 写的是 localhost,如果没在一台机器上,写上 prometheus 的 IP
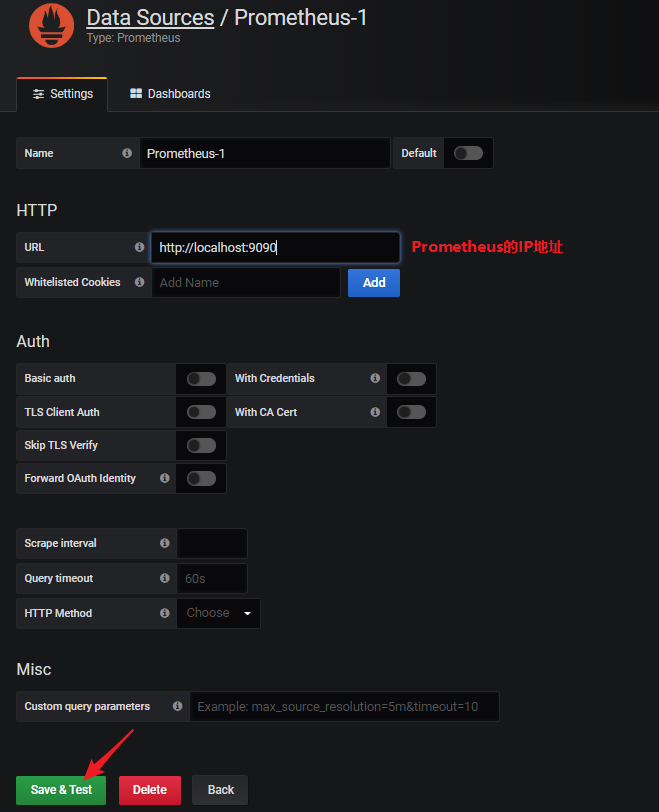
点击“save and test”,如果提示 success,代表配置成功
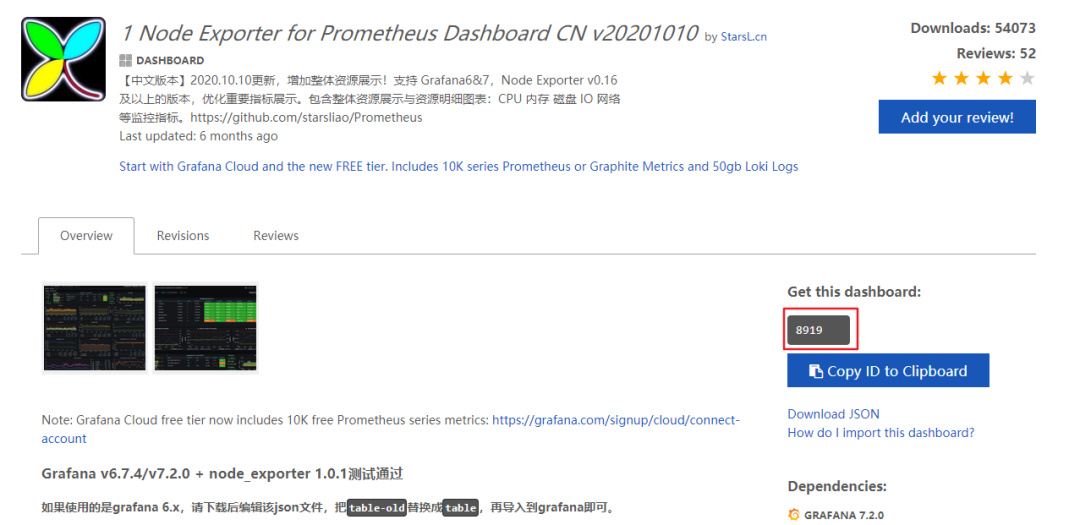
6、官网查找监控模板
打开 grafana 官网,查找官网提供的 prometheus 监控模板
https://grafana.com/grafana/dashboards
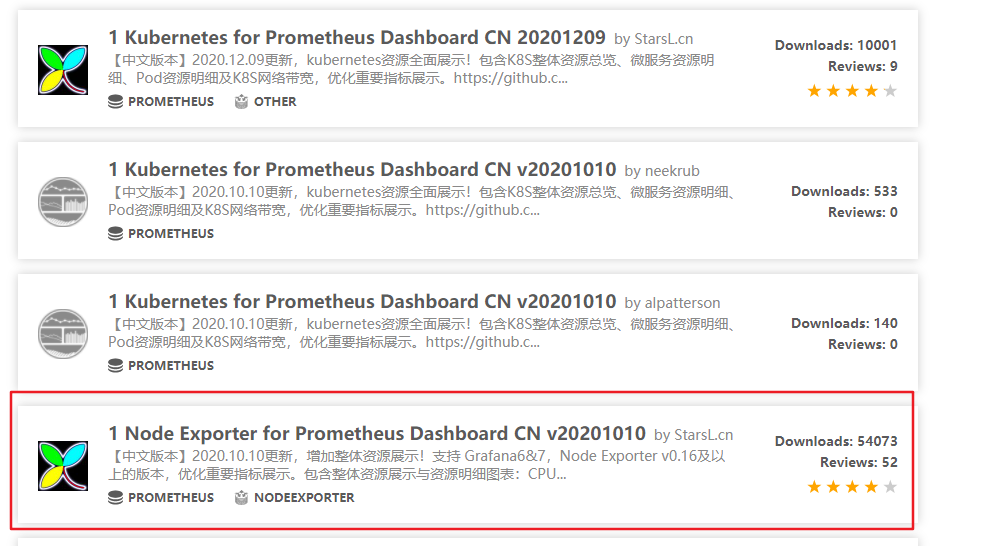
点击 Linux 服务器监控的中文模板,记录该模板的 id:8919
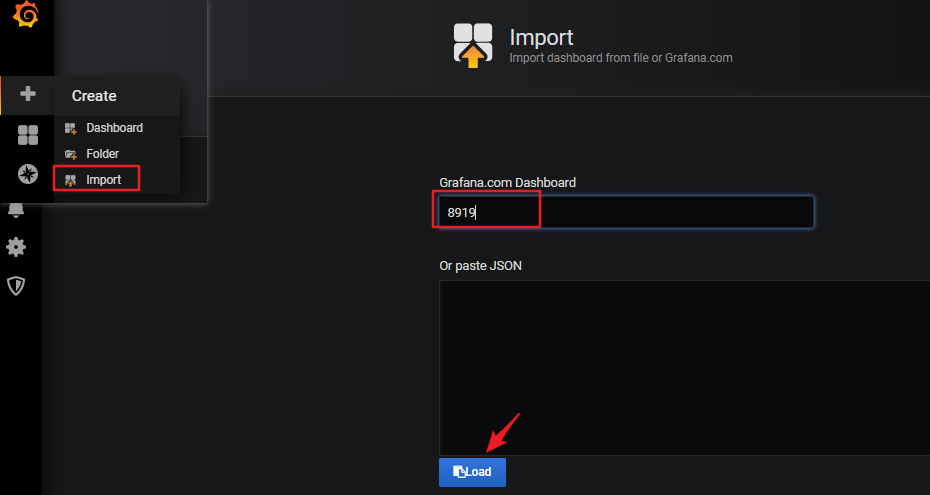
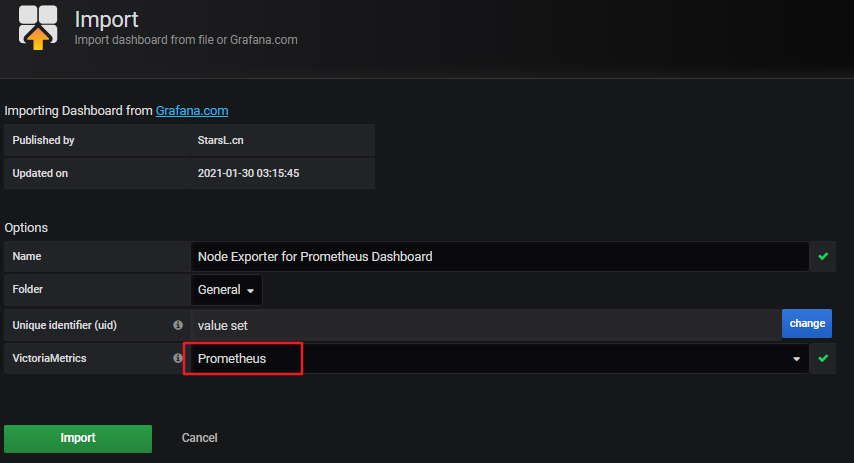
7、在 grafana 系统页面中,通过 id 导入该模板,即可在 grafana 中看到 192.168.1.26 机器的性能监控数据
8、将数据更新频率需要设置,就可以看到设置时间步长内的各项性能指标。包含了 CPU、Load、内存、网络、磁盘、IO 耗时等指标。监控数据永久保存,可以随时查看任意时间点内的历史统计数据,非常方便。
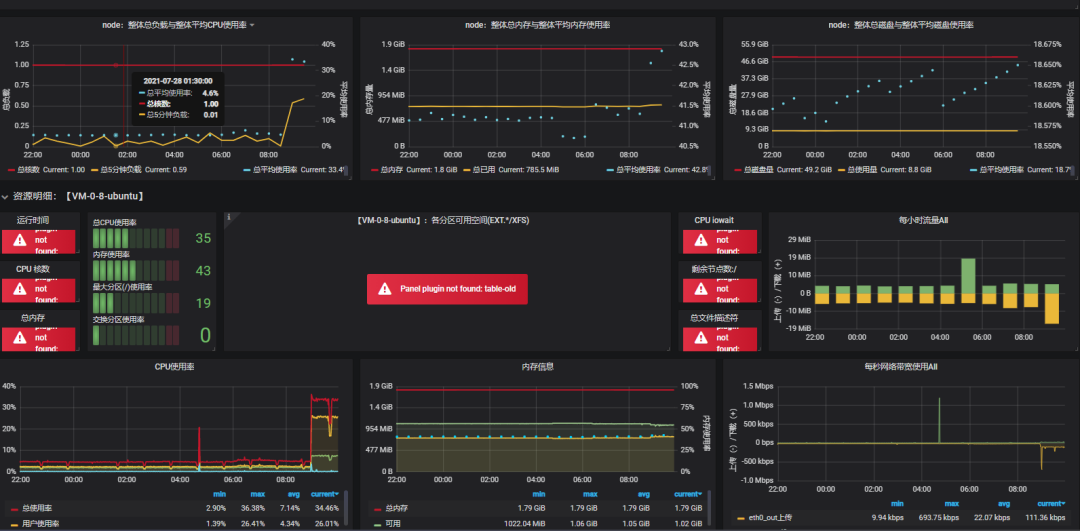
9、grafana服务启停
-
设置开机自启:systemctl start grafana-server
-
启动服务 sudo service grafana-server start
-
重启 sudo service grafana-server restart
-
停止服务 sudo service grafana-server stop
05 MySQL 的监控
1、下载 MySQL 的 exporter
https://github.com/prometheus/mysqld_exporter/releases/download/v0.12.1/mysqld_exporter-0.12.1.linux-amd64.tar.gz
2、上传至 MySQL 服务器上,解压包
tar xvf mysqld_exporter-0.12.1.linux-amd64.tar.gz
3、执行命令export DATA_SOURCE_NAME='root:admin1234@(192.168.1.30:3306)/'
4、启动 mysql exporter
进入到解压后的文件夹中,执行命令nohup ./mysqld_exporter &
监控 nohup.out 日志,有如下日志代表成功
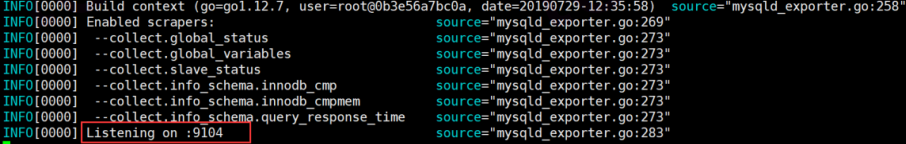
5、修改 prometheus 的配置文件 prometheus.yml vi prometheus.yml
增加监控 MySQL 的 job(注意缩进格式)
# my global config

global:

  scrape_interval:     2s # Set the scrape interval to every 15 seconds. Default is every 1 minute.

  evaluation_interval: 2s # Evaluate rules every 15 seconds. The default is every 1 minute.

  # scrape_timeout is set to the global default (10s).


# Alertmanager configuration

alerting:

  alertmanagers:

  - static_configs:

    - targets:

      # - alertmanager:9093


# Load rules once and periodically evaluate them according to the global 'evaluation_interval'.

rule_files:

  # - "first_rules.yml"

  # - "second_rules.yml"


# A scrape configuration containing exactly one endpoint to scrape:

# Here it's Prometheus itself.

scrape_configs:

  # The job name is added as a label `job=<job_name>` to any timeseries scraped from this config.

  - job_name: 'prometheus'


    # metrics_path defaults to '/metrics'

    # scheme defaults to 'http'.


    static_configs:

    - targets: ['localhost:9090']

  - job_name: 'node'

    static_configs:


  # 新增的服务器配置信息

  - job_name: 'node'

    static_configs:

    - targets: ['192.168.1.26:9100']


  # 新增的MySQL服务器配置信息

  - job_name: 'mysql'

    static_configs:

    - targets: ['192.168.1.30:9104']
targets 中的 IP 为 mysql_exporter 所在机器的 IP,端口号固定为 9104,重启 prometheus,进入 prometheus 的 UI 界面,在 status-targets 页面下,可以看到 MySQL exporter 的状态
6、在 Grafana 中添加 MySQL 的监控模板
在 grafana 官网模板中找到 MySQL 监控模板 Mysql Overview,id 为 7362,并导入到 Grafana 中(具体操作步骤参考上面导入 Linux 监控模板操作)
行动吧,在路上总比一直观望的要好,未来的你肯定会感谢现在拼搏的自己!如果想学习提升找不到资料,没人答疑解惑时,请及时加入群: 759968159,里面有各种测试开发资料和技术可以一起交流哦。
最后: 下方这份完整的软件测试视频教程已经整理上传完成,需要的朋友们可以自行领取【保证100%免费】
软件测试面试文档
我们学习必然是为了找到高薪的工作,下面这些面试题是来自阿里、腾讯、字节等一线互联网大厂最新的面试资料,并且有字节大佬给出了权威的解答,刷完这一套面试资料相信大家都能找到满意的工作。


 456
456

 被折叠的 条评论
为什么被折叠?
被折叠的 条评论
为什么被折叠?
 到【灌水乐园】发言


