


一、引子
最近在实验室优化基于 EPICS 协议的 Python 控制程序,其中,硅漂移探测器设备(silicon drifting detector, SDD)需要实时采集数据并图形化显示测试曲线。因此,在控制程序中使用到了 Matplotlib,以下代码片段为模拟实验数据采集过程,图1(a)为模拟实验数据采集显示效果。
for 循环结合 plt.ion() 和 plt.pause(0.1) 的用法已有很多教程谈及,此处不做详细介绍。
import time
import random
import numpy as np
import matplotlib.pyplot as plt

def tic():
    global T0
    T0 = time.time()

def toc():
    return time.time()-T0

x, y = np.array([]), np.array([])
plt.ion() #打开交互模式:https://matplotlib.org/stable/api/_as_gen/matplotlib.pyplot.ion.html
fig, ax = plt.subplots(1, 1)
tic()

for idx in range(100): #采集 100 个数据点
    time.sleep(1) #探测器单点采集时间为 1 秒
    x = np.append(x, idx) #将采集到的数据点横坐标写入 x 数组
    y = np.append(y, random.random()) #将采集到的数据点横坐标写入 y 数组
    ax.plot(x, y, 'o-', c='b') #画图
    plt.pause(0.1) #运行GUI事件循环 0.1 秒:https://matplotlib.org/stable/api/_as_gen/matplotlib.pyplot.pause.html

print(f'\nSpent {round(toc(),5)} seconds.')
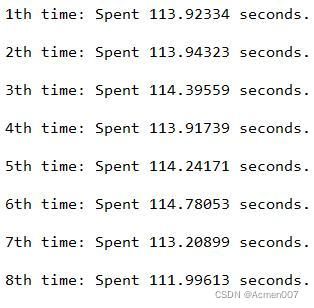
如图1(b)所示,运行以上代码片段多次,总时间大致为 114s,因而可暂时简单理解为其中 time.sleep(1) * 100 = 100s,plt.pause(0.1) * 100 ≈ 10s,110s ≈ 114s。循环中其余代码部分所占用时间几乎可忽略。
二、问题
 改变 plt.pause(interval) 中 interval 分别为 0.01,0.1,1。结果 0.01 与 0.1 差别极小。(图2(a))
 当不断增加 for 循环次数时,将出现严重的时间延迟现象。(图2(b))
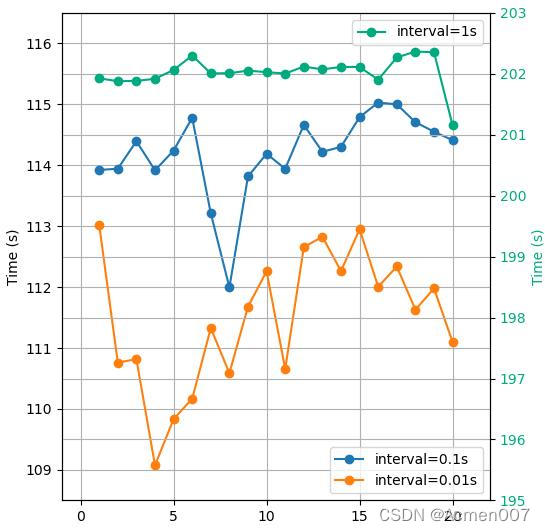
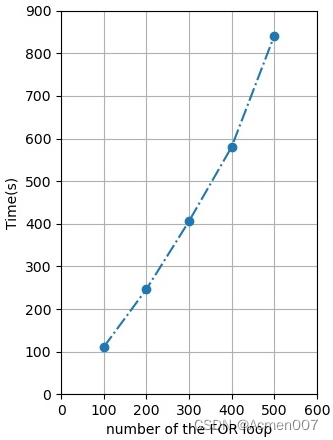
图2.(a)interval=0.01, 0.1, 1 各自对应 20 次测试所用时间结果。(b)interval=0.01s 时 100, 200, 300, 400, 500 次循环各自所用时间,非线性关系,呈抛物曲线逐渐上升趋势。
三、测试分析
参考源代码 pyplot.py 文件中函数 def pause(interval):,考虑先将引子代码片段中 plt.pause(0.1) 替换为源码,同时增加 for 循环至 1000 次,并在各部分加入计时,用于判断:
 plt.pause(0.01) 真的占时 0.01s 吗?
 延迟是由哪一步导致的?
import time
import random
import numpy as np
from matplotlib import _pylab_helpers
from matplotlib.pyplot import show
import matplotlib.pyplot as plt

def tic():
    global T0
    T0 = time.time()

def toc():
    return time.time()-T0

x, y = np.array([]), np.array([])
plt.ion()
fig, ax = plt.subplots(1, 1)
tic()
fid = open('data.txt', 'w') #写入计时数据,用于绘图分析

for idx in range(1000):
    time.sleep(1)
    x = np.append(x, idx)
    y = np.append(y, random.random())
    ax.plot(x, y, 'o-', c='b')
    #以下为 plt.pause() 替换源码部分,并加入计时
    fid.write(f'\nt0={round(toc(),5)}s\t')
	manager = _pylab_helpers.Gcf.get_active()
	if manager is not None:
	    canvas = manager.canvas
	    if canvas.figure.stale:
	   	    fid.write(f't1={round(toc(),5)}s\t')
	        canvas.draw_idle()
	        fid.write(f't2={round(toc(),5)}s\t')
	    show(block=False)
        fid.write(f't3={round(toc(),5)}s\t')
	    canvas.start_event_loop(0.01)
        fid.write(f't4={round(toc(),5)}s\t')
	else:
	    time.sleep(0.01)
	fid.flush()

print(f'\nSpent {round(toc(),5)} seconds.')
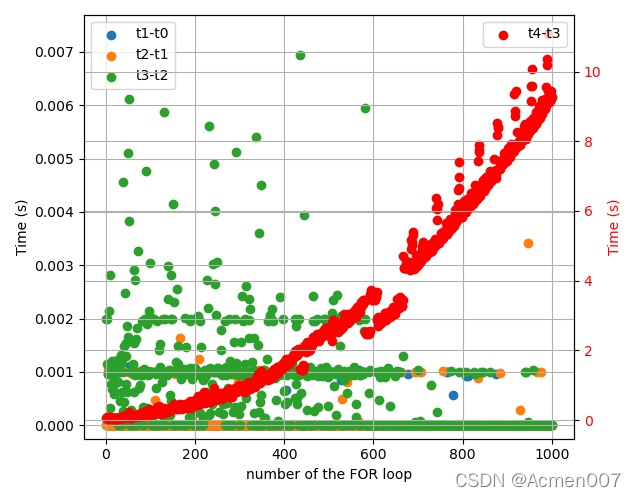
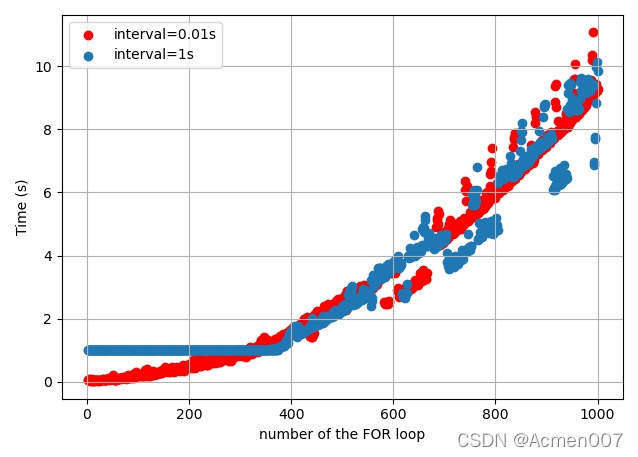
图3.(a)以上代码片段中源码部分各行所用时间,例如 t4-t3 即为第 37 行 canvas.start_event_loop(0.01) 所用时间。(b)interval 分别等于0.01s 和 1s 时 start_event_loop() 所用时间。
如图3(a)所示,可以判断 plt.pause(0.01) 占时部分为第 37 行的 canvas.start_event_loop(0.01) ,且并非真实占时 0.01s。在刚开始时,实际用时约为 0.05s,然而随着 for 循环运行,该行所用时间呈抛物曲线上升趋势,至第 1000 次循环时,已占时约 10s,出现上文提及的严重延迟情况。图3(b)中 interval=1s 时,同样在第 37 行出现了延迟。因此,该测试首先找到了延迟的来源:start_event_loop(),且表明最快达不到 0.01s,下面对其进行进一步分析。
首先分析 start_event_loop(),同样参考源代码 backend_bases.py 文件中函数 def start_event_loop(self, timeout=0)::
def flush_events(self):
	"""
	Flush the GUI events for the figure.
	Interactive backends need to reimplement this method.
	"""

def start_event_loop(self, timeout=0):
	"""
	Start a blocking event loop.
	Such an event loop is used by interactive functions, such as
	`~.Figure.ginput` and `~.Figure.waitforbuttonpress`, to wait for
	events.
	The event loop blocks until a callback function triggers
	`stop_event_loop`, or *timeout* is reached.
	If *timeout* is 0 or negative, never timeout.
	Only interactive backends need to reimplement this method and it relies
	on `flush_events` being properly implemented.
	Interactive backends should implement this in a more native way.
	"""
	if timeout <= 0:
	    timeout = np.inf
	timestep = 0.01
	counter = 0
	self._looping = True
	while self._looping and counter * timestep < timeout:
	    self.flush_events()
	    time.sleep(timestep)
	    counter += 1
同样源码替换并加入计时后,最终找到所有延迟占用时间均由 canvas.flush_events() 导致(此处不做详细说明展示)。此外,由该函数源代码可见,其中 timestep = 0.01,且 flush_events() 正常情况下也需要占用约 0.04s(无准确用时,由绘图情况所定)。因此,plt.pause(0.01) 与 plt.pause(0.1) 差别不明显,而 plt.pause(0.001) 等无实际意义。至此,问题归结为:
 什么是 flush_events() ?
 为什么 flush_event() 随着循环运行,延迟越来越长?
通过详细阅读 Matplotlib User guide Explanations 中的 Interactive figures,Event handling and picking 和 Interactive figures and asynchronous programming 等,最终解决该问题。
这主要涉及到对 GUI 事件循环的理解,Matplotlib 通过将图形嵌入 GUI 窗口来支持丰富的交互式图形,所有的GUI框架(Qt, Wx, Gtk, tk, OSX 或 web)都有一些捕获用户交互并将其传递回应用程序的方法(例如 Qt 中的 Signal / Slot 框架),但具体的细节取决于工具箱。 对于每个我们支持的 GUI 工具箱,Matplotlib 都有一个相应的后端,它通过工具箱的 API 将工具箱的 UI 事件连接到 Matplotlib 的事件处理系统(Event handling system)中。简单来说,事件可理解为用户输入,其种类有很多种,比如:
| Event name | Class | Description |
|---|---|---|
| ‘button_press_event’ | MouseEvent | mouse button is pressed |
| ‘close_event’ | CloseEvent | figure is closed |
| ‘draw_event’ | DrawEvent | canvas has been drawn (but screen widget not updated yet) |
举个例子,我们使用的工具栏中 panning/zooming 按钮、鼠标移动时右上角显示的 x,y 坐标等都是启动了 GUI 事件循环。关于 flush_events(),用户指南指出:如果打开的窗口有挂起的 UI 事件(鼠标单击、按钮按下或绘制),可以通过调用 FigureCanvasBase.flush_events 显式地处理这些事件。 这将运行 GUI 事件循环,直到当前等待的所有 UI 事件都被处理完毕。
综上,通过对 plt.pause(interval) 源代码的逐级查阅,发现对于我的应用目的,有两个关键点:canvas.draw_idle() 为 DrawEvent,从而存在挂起的 UI 事件,和 canvas.flush_events(),刷新当前图形的 GUI 事件。需要指出,canvas.draw_idle() 与 canvas.draw() 是存在区别的,其中 draw() 强制对图形进行渲染,而 draw_idle() 是计划一次渲染,在下一次 GUI 窗口准备重绘屏幕时。
为何刷新 GUI 绘图事件会如此卡顿?此时答案很显然,每一次的 ax.plot(x, y, ‘o-’, c=‘b’) 都创建了一个新的 Artist 对象(Line2D),因此当循环达到 1000 次时,刷新 GUI 绘图事件将占用极长的时间。事实上,这也是在阅读了Matplotlib User guide Explanations 后想到的,同时指南中其实就给出了对于我的应用目的的代码片段:
import time
import matplotlib.pyplot as plt
import numpy as np
plt.ion()

fig, ax = plt.subplots()
th = np.linspace(0, 2*np.pi, 512)
ax.set_ylim(-1.5, 1.5)

ln, = ax.plot(th, np.sin(th)) #预先创建一个 Line2D 对象,避免后期重复创建

def slow_loop(N, ln):
    for j in range(N):
        time.sleep(.1)  # to simulate some work
        if j % 10:
            ln.set_ydata(np.sin(((j // 10) % 5 * th))) #刷新 ln 实例的 y 轴数值,而非再次调用 ax.plot()
            ln.figure.canvas.draw_idle() #画布渲染
        ln.figure.canvas.flush_events() #刷新 GUI 绘图事件以显示最新数据图形

slow_loop(100, ln)
四、解决方案
最后,综合以上讨论测试等,给出几种方案,大同小异。图4为三种方法100, 200, 300, 400, 500 次循环各自所用时间对比。显然,结果呈线性趋势,与图2(b)的结果大相径庭。此外,测试表明方法 ②、③ 所用时间最短且接近(懒得做 error bar 了,也懒得 1000+ For loop 了,分不出究竟孰快孰慢)。需要指出,个人认为 ③ 拓展性更强,且 fig.canvas.draw_idle() 有进一步优化空间,在对绘图刷新频率有较高要求时,可深入研究优化,因此更推荐该方法。
① cla() 清除大法
import time
import random
import numpy as np
import matplotlib.pyplot as plt

plt.ion()
x, y = np.array([]), np.array([])
fig, ax = plt.subplots(1, 1)

for idx in range(1000):
    time.sleep(1)
    x = np.append(x, idx)
    y = np.append(y, random.random())
    ax.cla() #每次循环画图前先清空当前坐标轴,包括 Line2D 对象
    ax.plot(x, y, 'o-', c='b') #画图
    plt.pause(0.01)
② set_xdata(), set_ydata() 刷新 Line2D 对象数据大法
plt.ion()
x, y = np.arange(1,1001), np.zeros((1000,1))
fig, ax = plt.subplots(1, 1)
ln, = ax.plot(x, y, 'o-', c='b')

for idx in range(1000):
    time.sleep(1)
    y[idx] = random.random()
    ln.set_ydata(y)
    ax.set_xlim(x[0]-1,x[idx])
    ax.set_ylim(min(y),max(y))
    plt.pause(0.01)
③ set data + 精简 GUI 事件循环大法
plt.ion()
x, y = np.arange(1,1001), np.zeros((1000,1))
fig, ax = plt.subplots(1, 1)
ln, = ax.plot(x, y, 'o-', c='b')

for idx in range(1000):
    time.sleep(1)
    y[idx] = random.random()
    ln.set_ydata(y)
    ax.set_xlim(x[0]-1,x[idx])
    ax.set_ylim(min(y),max(y))
    fig.canvas.draw_idle()
    fig.canvas.flush_events()


 被折叠的 条评论
为什么被折叠?
被折叠的 条评论
为什么被折叠?
 到【灌水乐园】发言


