


数据准备
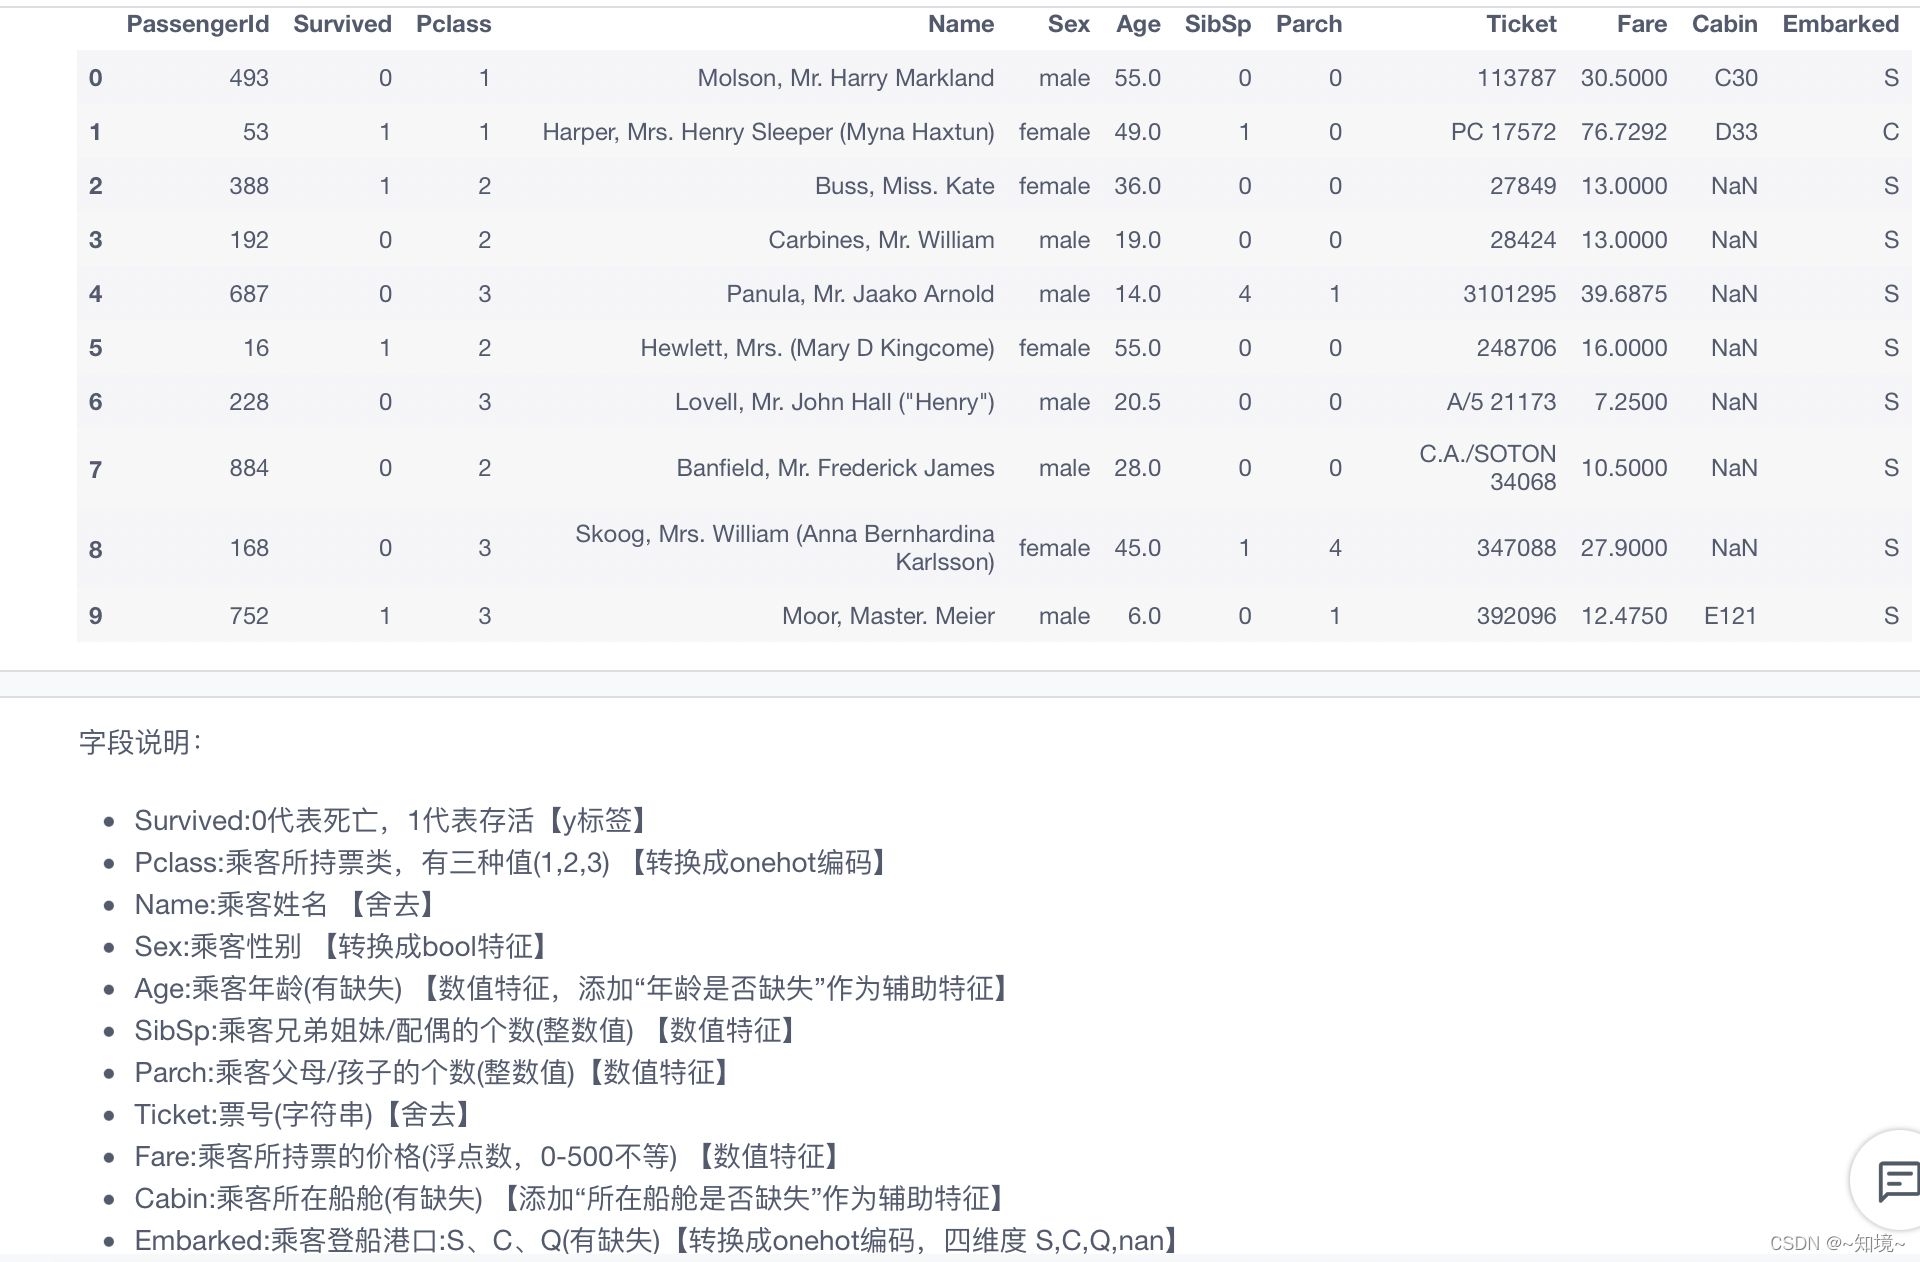
使用titanic数据集
数据集情况说明
数据可视化,使用matplotlib进行可是化数据
%matplotlib inline
%config InlineBackend.figure_format = 'png'
ax = dftrain_raw['Survived'].value_counts().plot(kind = 'bar',
     figsize = (12,8),fontsize=15,rot = 0)
ax.set_ylabel('Counts',fontsize = 15)
ax.set_xlabel('Survived',fontsize = 15)
plt.show()
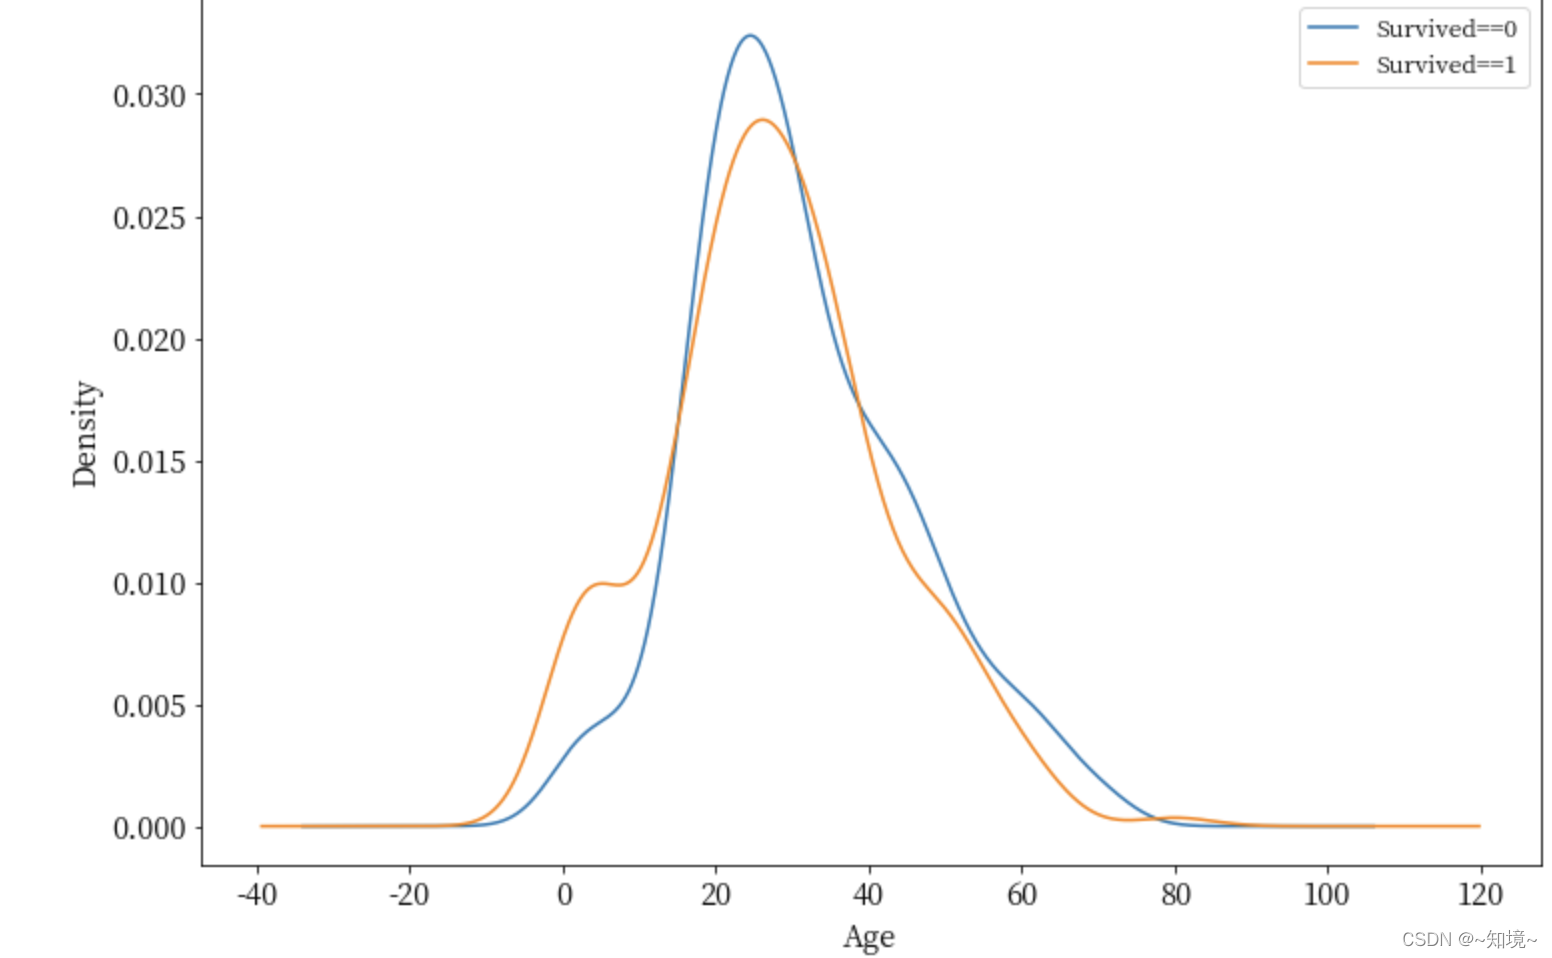
这可以画出年龄密度的曲线图
%matplotlib inline
%config InlineBackend.figure_format = 'png'
ax = dftrain_raw.query('Survived == 0')['Age'].plot(kind = 'density',
                      figsize = (12,8),fontsize=15)
dftrain_raw.query('Survived == 1')['Age'].plot(kind = 'density',
                      figsize = (12,8),fontsize=15)
ax.legend(['Survived==0','Survived==1'],fontsize = 12)
ax.set_ylabel('Density',fontsize = 15)
ax.set_xlabel('Age',fontsize = 15)
plt.show()
数据预处理
用到pandas的get_dymmies函数,这个函数就是把数据进行one-hot编码
def preprocessing(dfdata):

    dfresult= pd.DataFrame()

    #Pclass
    dfPclass = pd.get_dummies(dfdata['Pclass'])  #get_dummies可以实现one-hot编码
    dfPclass
最低0.47元/天 解锁文章


 2381
2381

 被折叠的 条评论
为什么被折叠?
被折叠的 条评论
为什么被折叠?
 到【灌水乐园】发言


