


下载Flex图表插件 http://download.csdn.net/detail/allen_gang/5557877
1.柱形图
<?xml version="1.0" encoding="utf-8" ?>

 <s:Application xmlns:fx="http://ns.adobe.com/mxml/2009" xmlns:s="library://ns.adobe.com/flex/spark" xmlns:mx="library://ns.adobe.com/flex/mx" xmlns:amcharts="http://www.amcharts.com/com_internal" backgroundColor="#FFFFFF" width="100%" height="100%" viewSourceURL="srcview/index.html">
	   <fx:Script>
			 <![CDATA[             import mx.collections.ArrayCollection;

				[Bindable]
				private var chartData:ArrayCollection = new ArrayCollection([
					{year:2005,income:23.5,expenses:18.1},
					{year:2006,income:26.2,expenses:22.8},
					{year:2007,income:30.1,expenses:23.9},
					{year:2008,income:29.5,expenses:25.1},
					{year:2009,income:24.6,expenses:25.0}
				]);


			]]>
		</fx:Script>
	    <s:VGroup width="100%" height="100%">
			  <amcharts:AmSerialChart width="100%" height="100%" id="chart" dataProvider="{chartData}" categoryField="year" startDuration="1" angle="30" depth3D="30">
				   <amcharts:categoryAxis>
						<amcharts:CategoryAxis gridPosition="start" />
					</amcharts:categoryAxis>
				   <amcharts:graphs>
						<amcharts:AmGraph title="Income" id="g0" valueField="income" type="column" lineAlpha="0" fillAlphas="[1]" />
						<amcharts:AmGraph title="Expenses" id="g1" valueField="expenses" type="line" lineThickness="2" bullet="round" />
					</amcharts:graphs>
			  </amcharts:AmSerialChart>

			<amcharts:AmLegend dataProvider="{chart}" width="100%" switchType="v" marginRight="20" marginLeft="40" textClickEnabled="false" marginBottom="15" />
		</s:VGroup>
  </s:Application>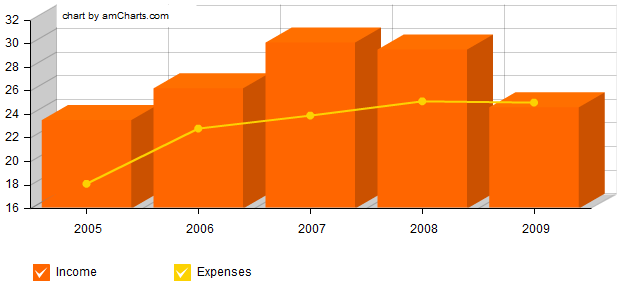
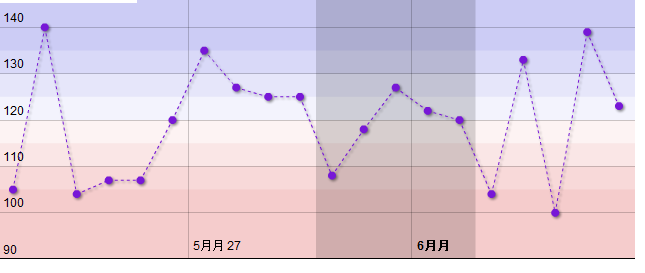
2.折线图
<?xml version="1.0" encoding="utf-8" ?>

 <s:Application xmlns:fx="http://ns.adobe.com/mxml/2009" xmlns:s="library://ns.adobe.com/flex/spark" xmlns:mx="library://ns.adobe.com/flex/mx" xmlns:amcharts="http://www.amcharts.com/com_internal" backgroundColor="#FFFFFF" width="100%" height="100%" creationComplete="{generateChartData()}" viewSourceURL="srcview/index.html">
	    <fx:Script>
			  <![CDATA[             import com.amcharts.axes.Guide;
				import com.amcharts.chartClasses.AmGraph;
				import mx.collections.ArrayCollection;
				import flash.filters.DropShadowFilter;

				[Bindable]
				private var chartData:ArrayCollection = new ArrayCollection();
				// generate some random data
				private function generateChartData():void{
					var firstDate:Date = new Date();
					firstDate.setDate(firstDate.getDate() - 20);

					for(var i:Number = 0; i < 20; i++){
						var newDate:Date = new Date(firstDate);
						newDate.setDate(newDate.getDate() + i);

						var visits:Number = Math.round(Math.random() * 40) + 100;

						chartData.addItem({date:newDate, visits:visits});
					}

					// create guide and add it to category axis
					var verticalGuideDate:Date = new Date();
					verticalGuideDate.setHours(0,0,0,0);
					verticalGuideDate.date -= 10;

					var verticalGuideToDate:Date = new Date();
					verticalGuideToDate.setHours(0,0,0,0);
					verticalGuideToDate.date -= 5;

					var guide:Guide = new Guide();
					guide.date = verticalGuideDate;
					guide.toDate = verticalGuideToDate;
					guide.fillAlpha = 0.15;
					guide.lineAlpha = 0;

					catAxis.addGuide(guide);
				}

				[Bindable]
				private var shadow:DropShadowFilter = new DropShadowFilter(2,45,0,0.5);


			]]>
		</fx:Script>
	  <amcharts:AmSerialChart id="chart" width="50%" height="50%" autoMargins="false" marginTop="0" marginLeft="0" marginRight="0" marginBottom="0" dataProvider="{chartData}" categoryField="date">
			  <amcharts:graphs>
				  <amcharts:AmGraph id="g1" lineColor="#7717D7" title="Visits" valueField="visits" type="line" dashLength="3" lineThickness="1" bullet="round" filters="{[shadow]}" />
			  </amcharts:graphs>
			  <amcharts:valueAxes>
				  <amcharts:ValueAxis inside="true" tickLength="0">

						 <amcharts:guides>
							  <amcharts:Guide value="0" toValue="105" fillColor="#CC0000" fillAlpha="0.20" lineAlpha="0" />
							  <amcharts:Guide value="105" toValue="110" fillColor="#CC0000" fillAlpha="0.15" lineAlpha="0" />
							  <amcharts:Guide value="110" toValue="115" fillColor="#CC0000" fillAlpha="0.10" lineAlpha="0" />
							  <amcharts:Guide value="115" toValue="120" fillColor="#CC0000" fillAlpha="0.05" lineAlpha="0" />
							  <amcharts:Guide value="120" toValue="125" fillColor="#0000cc" fillAlpha="0.05" lineAlpha="0" />
							  <amcharts:Guide value="125" toValue="130" fillColor="#0000cc" fillAlpha="0.10" lineAlpha="0" />
							  <amcharts:Guide value="130" toValue="135" fillColor="#0000cc" fillAlpha="0.15" lineAlpha="0" />
							  <amcharts:Guide value="135" toValue="200" fillColor="#0000cc" fillAlpha="0.20" lineAlpha="0" />
						  </amcharts:guides>
					</amcharts:ValueAxis>
			  </amcharts:valueAxes>
			 <amcharts:categoryAxis>

				  <amcharts:CategoryAxis id="catAxis" parseDates="true" minPeriod="DD" inside="true" tickLength="0" />
			  </amcharts:categoryAxis>
			 <amcharts:chartCursor>
				  <amcharts:ChartCursor />
			  </amcharts:chartCursor>
			  <amcharts:chartScrollbar>
				  <amcharts:ChartScrollbar graph="{g1}" hideResizeGrips="false" />
			  </amcharts:chartScrollbar>
		</amcharts:AmSerialChart>
  </s:Application>
<?xml version="1.0" encoding="utf-8" ?>
<s:Application xmlns:fx="http://ns.adobe.com/mxml/2009" xmlns:s="library://ns.adobe.com/flex/spark" xmlns:mx="library://ns.adobe.com/flex/mx" xmlns:amcharts="http://www.amcharts.com/com_internal" backgroundColor="#FFFFFF" width="100%" height="100%" viewSourceURL="srcview/index.html">
<fx:Style>@font-face { fontFamily: "Tahoma"; embedAsCFF: false; unicode-range: U+0020-U+0040, /* Punctuation, Numbers */ U+0041-U+005A, /* Upper-Case A-Z */ U+005B-U+0060, /* Punctuation and Symbols */ U+0061-U+007A, /* Lower-Case a-z */ U+007B-U+007E; /* Punctuation and Symbols */ } .MyTextStyle { font-family: Tahoma; }</fx:Style>
<fx:Script>
<![CDATA[ import mx.collections.ArrayCollection;
[Bindable]
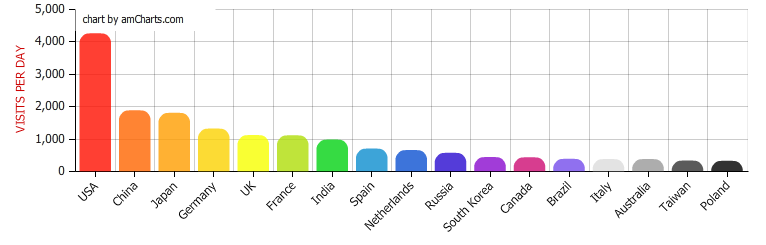
private var chartData:Array = [{country:"USA",visits:4252,color:0xFF0F00},
{country:"China",visits:1882,color:0xFF6600},
{country:"Japan",visits:1809,color:0xFF9E01},
{country:"Germany",visits:1322,color:0xFCD202},
{country:"UK",visits:1122,color:0xF8FF01},
{country:"France",visits:1114,color:0xB0DE09},
{country:"India",visits:984,color:0x04D215},
{country:"Spain",visits:711,color:0x0D8ECF},
{country:"Netherlands",visits:665,color:0x0D52D1},
{country:"Russia",visits:580,color:0x2A0CD0},
{country:"South Korea",visits:443,color:0x8A0CCF},
{country:"Canada",visits:441,color:0xCD0D74},
{country:"Brazil",visits:395,color:0x754DEB},
{country:"Italy",visits:386,color:0xDDDDDD},
{country:"Australia",visits:384,color:0x999999},
{country:"Taiwan",visits:338,color:0x333333},
{country:"Poland",visits:328,color:0x000000}];
]]>
</fx:Script>
<amcharts:AmSerialChart rotate="false" styleName="MyTextStyle" width="60%" height="40%" id="chart" dataProvider="{chartData}" categoryField="country" startDuration="1">
<amcharts:graphs>
<amcharts:AmGraph cornerRadiusTop="10" valueField="visits" balloonText="[[category]]: [[value]]" colorField="color" type="column" lineAlpha="0" fillAlphas="[0.8]" />
</amcharts:graphs>
<amcharts:valueAxes>
<amcharts:ValueAxis title="VISITS PER DAY" titleTextColor="#CC0000" />
</amcharts:valueAxes>
<amcharts:categoryAxis>
<amcharts:CategoryAxis gridPosition="start" labelRotation="45" gridCount="{chartData.length}" />
</amcharts:categoryAxis>
<amcharts:balloon>
<amcharts:AmBalloon cornerRadius="10" borderThickness="2" borderColor="#FFFFFF" borderAlpha="1" />
</amcharts:balloon>
<amcharts:chartCursor>
<amcharts:ChartCursor zoomable="false" cursorAlpha="0" categoryBalloonEnabled="false" />
</amcharts:chartCursor>
</amcharts:AmSerialChart>
</s:Application>
3.饼状图
<?xml version="1.0" encoding="utf-8" ?>

 <s:Application xmlns:fx="http://ns.adobe.com/mxml/2009" xmlns:s="library://ns.adobe.com/flex/spark" xmlns:mx="library://ns.adobe.com/flex/mx" xmlns:amcharts="http://www.amcharts.com/com_internal" backgroundColor="#FFFFFF" width="100%" height="100%" viewSourceURL="srcview/index.html">
		  <fx:Style>@font-face {   fontFamily: "Tahoma"; embedAsCFF: false; unicode-range: U+0020-U+0040, /* Punctuation, Numbers */ U+0041-U+005A, /* Upper-Case A-Z */ U+005B-U+0060, /* Punctuation and Symbols */ U+0061-U+007A, /* Lower-Case a-z */ U+007B-U+007E; /* Punctuation and Symbols */ } .MyTextStyle { font-family: Tahoma; }</fx:Style>
	    <fx:Script>
		  <![CDATA[             import mx.collections.ArrayCollection;
				import flash.filters.DropShadowFilter;

				[Bindable]
				private var chartData:Array = [{country:"USA",visits:4252},{country:"China",visits:1882},{country:"Japan",visits:1809},{country:"Germany",visits:1322},{country:"UK",visits:1122},{country:"France",visits:1114},{country:"India",visits:984},{country:"Spain",visits:711},{country:"Netherlands",visits:665},{country:"Russia",visits:580},{country:"South Korea",visits:443},{country:"Canada",visits:441},{country:"Brazil",visits:395},{country:"Italy",visits:386},{country:"Australia",visits:384},{country:"Taiwan",visits:338},{country:"Poland",visits:328}];

				[Bindable]
				private var shadow:DropShadowFilter = new DropShadowFilter(2,45,0,0.5);


			]]>
		</fx:Script>
	    <s:HGroup width="100%" height="100%">
			  <amcharts:AmPieChart styleName="MyTextStyle" width="50%" height="50%" dataProvider="{chartData}" valueField="visits" titleField="country" angle="5" depth3D="5" innerRadius="10" groupPercent="3" gradient="radial" filters="{[shadow]}" startDuration="1.5" startRadius="100" marginLeft="0" marginRight="0" labelWidth="100">
				    <amcharts:balloon>
						<amcharts:AmBalloon cornerRadius="10" borderThickness="2" borderColor="#FFFFFF" borderAlpha="1" />
					</amcharts:balloon>
			  </amcharts:AmPieChart>

		</s:HGroup>
  </s:Application>


 388
388

 被折叠的 条评论
为什么被折叠?
被折叠的 条评论
为什么被折叠?
 到【灌水乐园】发言


