思路分为以下:三步:
1:创建SolidChart组件,像制作二维图表一样正常显示数据部分。
2:自定义ColumnChart的ItemRenderer项呈示器,并指定ColumnSeries的itemRenderer属性为刚自定义的项项呈示器。
3:创建MXML应用程序,将刚制作好的ColumnChart组件放入显示。
这样自定义组件,也是为了以后可以复用的考虑。
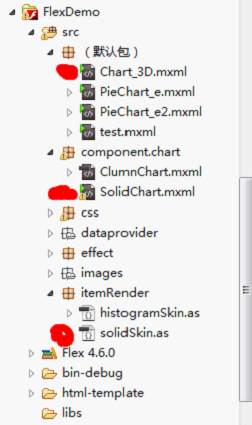
项目目录结构如下:前面点红色部分是本例所能使用到的。
第一步:创建SolidChart.组件,代码如下:commponent.chart/SolidChart.MXML
<?xml version="1.0" encoding="utf-8"?>
<mx:Panel xmlns:mx="library://ns.adobe.com/flex/mx"
		  xmlns:s="library://ns.adobe.com/flex/spark"
		  xmlns:fx="http://ns.adobe.com/mxml/2009"
		  width="100%"
		  height="100%"
		  title="{Title}"
		  layout="absolute"
		  >
	<fx:Script>
		<![CDATA[
			import itemRender.histogramSkin;
			import mx.charts.chartClasses.CartesianCanvasValue;
			import mx.charts.events.ChartItemEvent;
			import mx.charts.events.LegendMouseEvent;
			import mx.charts.renderers.BoxItemRenderer;
			import mx.collections.ArrayCollection;
			import mx.events.FlexEvent;
			import mx.graphics.codec.JPEGEncoder;

		[Bindable]
		public var expenses:ArrayCollection; //数据集合

		[Bindable]
		private var Title:String;   //Panel头部信息
		public function init(datas:ArrayCollection,title:String):void{
			expenses = new ArrayCollection();
			Title = title;  //初始化Panel头部信息
			expenses = datas;  //初始化表的数据集合
		}

		protected function legend1_itemMouseDownHandler(event:LegendMouseEvent):void
			{
				var index:int=-1;
				for(var i:int=0;i<myChart.series.length;i++){
					if(event.item.label==myChart.series[i].displayName){
						index=i;
					}
					myChart.series[i].visible=false;
				}
				myChart.series[index].visible=true;
			}
		]]>
	</fx:Script>
	<fx:Declarations>
		<fx:Array id="fillcolor">
			<s:SolidColor color="#EF7651" alpha="0.5"/>
			<s:SolidColor color="#E9C836" alpha="0.6" />
			<s:SolidColor color="#6FB35F" alpha="0.7" />
			<s:SolidColor color="#A1AECF" alpha="0.8" />
			<s:SolidColor color="green" alpha="0.9" />
		</fx:Array>
		<mx:SeriesSlide  id="SlideIn" direction="up" duration="3000"/>
		<mx:SeriesSlide  id="SlideOut" direction="down" duration="1000"/>
		</fx:Declarations>

	<mx:ColumnChart id="myChart"
		            horizontalCenter="true"
					fontSize="13.5"
                    dataProvider="{expenses}"
					showDataTips="true"
					textAlign="center"
					width="95%"
					height="100%"
					>
		<mx:horizontalAxis>
			<mx:CategoryAxis  categoryField="name"
							  displayName="动画名称"
							  title="动画名称"/>
		</mx:horizontalAxis>

		<mx:verticalAxis>
			<mx:LinearAxis title="数量"
						   autoAdjust="true"
						   alignLabelsToInterval="true"
						   computedMaximum="800"
						   displayName="数量"
						   interval="100"
						   maximum="800"
						   />
		</mx:verticalAxis>
		<mx:series>
			<mx:ColumnSeries displayName="人气指数" yField="hot"     itemRenderer="itemRender.solidSkin"
							 showDataEffect="{SlideIn}" showEffect="{SlideIn}"
							 />
			<mx:ColumnSeries displayName="剧场版数" yField="theatre" itemRenderer="itemRender.solidSkin"
							 showDataEffect="{SlideIn}" showEffect="{SlideIn}"
							/>
			<mx:ColumnSeries displayName="已出集数" yField="blues"   itemRenderer="itemRender.solidSkin"
							 showDataEffect="{SlideIn}" showEffect="{SlideIn}"
							/>
			<mx:ColumnSeries displayName="好评度"  yField="rating"  itemRenderer="itemRender.solidSkin"
							 showDataEffect="{SlideIn}" showEffect="{SlideIn}"
							/>
			<mx:ColumnSeries displayName="发展趋势" yField="trends"  itemRenderer="itemRender.solidSkin"
							 showDataEffect="{SlideIn}" showEffect="{SlideIn}"
							/>
		</mx:series>
	</mx:ColumnChart>
	<mx:Legend id="legend1"
		       right="40" top="30" height="151"
			   dataProvider="{myChart}"
			   toolTip="点击图例名称可只显示
一个相应栏目"
			   itemClick="legend1_itemMouseDownHandler(event)"
			   />
</mx:Panel> //自定义柱状图的外观类——实现立方效果
package itemRender
{
import flash.display.Graphics;
import flash.geom.Point;
import flash.geom.Rectangle;
import mx.charts.ChartItem;
import mx.charts.chartClasses.GraphicsUtilities;
import mx.charts.series.ColumnSeries;
import mx.charts.series.items.ColumnSeriesItem;
import mx.collections.ArrayCollection;
import mx.controls.Text;
import mx.core.IDataRenderer;
import mx.graphics.IFill;
import mx.graphics.IStroke;
import mx.graphics.SolidColor;
import mx.skins.ProgrammaticSkin;
import mx.utils.ColorUtil;
import spark.primitives.Graphic;
//ProgrammaticSkin是外观元素的基类,他们通过编程方式绘制自身。
public class solidSkin extends ProgrammaticSkin implements IDataRenderer
{
//data属性表示要呈示或编辑的数据,在这里指chartItem,柱状图的一列
private var _data:Object;
//创建柱状图的一列
private var _chartItem:ColumnSeriesItem;
//构造函数
public function solidSkin()
{
super();
}
public function get data():Object
{
return Object(_chartItem);
}
public function set data(value:Object):void
{
_chartItem = value as ColumnSeriesItem;
//标记组件,以便在稍后屏幕更新期间调用该组件的 updateDisplayList() 方法。
invalidateDisplayList();
}
//从ProgramaticSkin继承的方法,通过编程方式绘制自身
override protected function updateDisplayList(unscaledWidth:Number, unscaledHeight:Number):void
{
super.updateDisplayList(unscaledWidth,unscaledHeight);
//清除画布
this.graphics.clear();
//得到立方图的8个点坐标
var points:Array = getPoints(unscaledWidth*0.65,unscaledHeight);
//柱状图展示,只需要3面就可,画3个矩形即可。
drawFill(points[4],points[7],points[6],points[5]);
drawFill(points[6],points[2],points[3],points[7]);
drawFill(points[7],points[4],points[0],points[3]);
this.graphics.endFill();
}
//根据长宽计算8点坐标信息
protected function getPoints(w:Number,h:Number):Array
{
var points:Array = new Array(8);
points[0] = new Point(0,h);
points[1] = new Point(w,h);
points[2] = new Point(w,0);
points[3] = new Point(0,0);
points[4] = new Point(0+w/2.0,h+w/2.0);
points[5] = new Point(w+w/2.0,h+w/2.0);
points[6] = new Point(w+w/2.0,0+w/2.0);
points[7] = new Point(0+w/2.0,0+w/2.0);
return points;
}
//根据传入的坐标信息,绘制线条及填充绘制区域
protected function drawFill(...args):void
{
var fill:IFill;//定义执行填充的类必须实现的接口。
var state:String = "";//定义当前组件的视图状态
//以下代码为默认项呈示器的内容,用来判断每个系列的颜色,
if (_data is ChartItem && _data.hasOwnProperty('fill'))
{
state = _data.currentState;
fill = _data.fill;
}
else{
fill = GraphicsUtilities.fillFromStyle(getStyle('fill'));
}
var color:uint;
var adjustedRadius:Number = 0;
switch (state)
{
case ChartItem.FOCUSED:
case ChartItem.ROLLOVER:
if (styleManager.isValidStyleValue(getStyle('itemRollOverColor')))
color = getStyle('itemRollOverColor');
else
color = ColorUtil.adjustBrightness2(GraphicsUtilities.colorFromFill(fill),-20);
fill = new SolidColor(color);
adjustedRadius = getStyle('adjustedRadius');
if (!adjustedRadius)
adjustedRadius = 0;
break;
case ChartItem.DISABLED:
if (styleManager.isValidStyleValue(getStyle('itemDisabledColor')))
color = getStyle('itemDisabledColor');
else
color = ColorUtil.adjustBrightness2(GraphicsUtilities.colorFromFill(fill),20);
fill = new SolidColor(GraphicsUtilities.colorFromFill(color));
break;
case ChartItem.FOCUSEDSELECTED:
case ChartItem.SELECTED:
if (styleManager.isValidStyleValue(getStyle('itemSelectionColor')))
color = getStyle('itemSelectionColor');
else
color = ColorUtil.adjustBrightness2(GraphicsUtilities.colorFromFill(fill),-30);
fill = new SolidColor(color);
adjustedRadius = getStyle('adjustedRadius');
if (!adjustedRadius)
adjustedRadius = 0;
break;
}
var stroke:IStroke = getStyle("stroke");
var w:Number = stroke ? stroke.weight / 2 : 0;
var rc:Rectangle = new Rectangle(w - adjustedRadius, w - adjustedRadius, width - 2 * w + adjustedRadius * 2, height - 2 * w + adjustedRadius * 2);
var g:Graphics = graphics;
if (stroke)
stroke.apply(g,null,null);
if (fill)
fill.begin(g,rc,null);
g.moveTo(args[0].x,args[0].y);
for(var i:int=1;i<args.length;i++)
{
g.lineTo(args[i].x,args[i].y);
}
}
}
} <?xml version="1.0" encoding="utf-8"?>
<s:Application xmlns:fx="http://ns.adobe.com/mxml/2009"
xmlns:s="library://ns.adobe.com/flex/spark"
xmlns:mx="library://ns.adobe.com/flex/mx"
xmlns:chart="component.chart.*"
creationComplete="init()">
<fx:Style source="css/Chart3D.css"/>
<fx:Script>
<![CDATA[
import mx.collections.ArrayCollection;
[Bindable]
public var funs:ArrayCollection=new ArrayCollection([//创建数据集合
{name:"海贼王",hot:90,theatre:110,blues:482,rating:90,trends:100},
{name:"死神",hot:60,theatre:120,blues:230,rating:460,trends:570},
{name:"火影忍者",hot:80,theatre:413,blues:520,rating:80,trends:340},
{name:"柯南",hot:250,theatre:340,blues:600,rating:370,trends:430}
]);//传入数据源,显示柱状图
protected function init():void {
chart1.init(funs,"柱状图——立方图");
}
]]>
</fx:Script>
<chart:SolidChart id="chart1" x="-4" y="3"/>
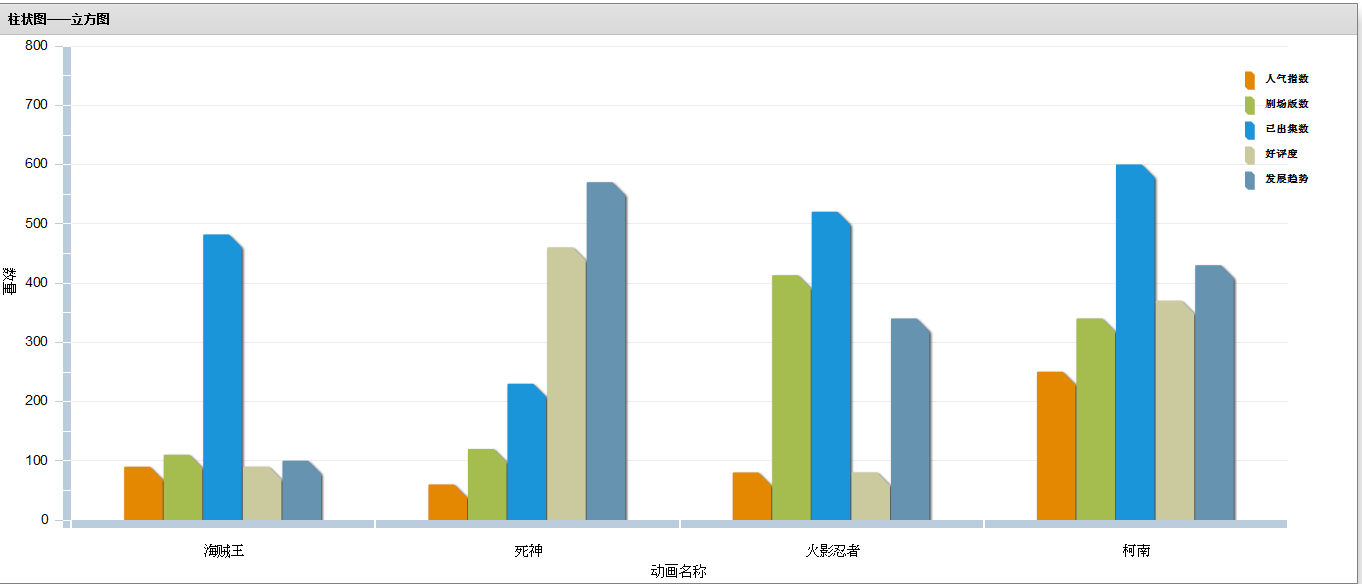
</s:Application> 最终效果如图:


 3459
3459

 被折叠的 条评论
为什么被折叠?


