


使用 echartys
1.使用其他插件 ,直接npm安装即可:
npm install echarts -S //安装echarts依赖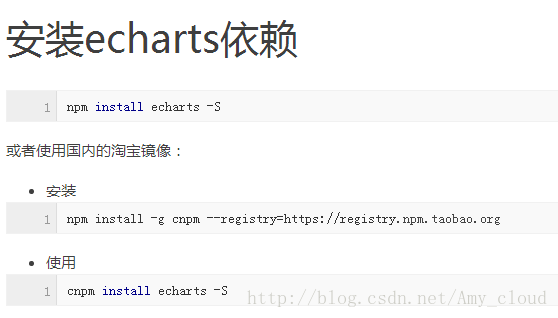
2.创建图表,在 main.js 全局引入
import echarts from 'echarts'
Vue.prototype.$echarts = echarts
3.在需要使用 echarts 图表的地方 ,插入 html标签以及 js
<template>
    <div id="myChart" :style="{width: '1500px', height: '600px'}"></div>
</template><script>
export default {
mounted(){
this.drawLine();
},
methods: {
drawLine(){
// 基于准备好的dom,初始化echarts实例
let myChart = this.$echarts.init(document.getElementById('myChart'))
// 绘制图表
myChart.setOption({
title: { text: '冬季销量统计' },
tooltip: {},
xAxis: {
data: ["衬衫","羊毛衫","雪纺衫","裤子","高跟鞋","袜子",'毛衣','秋裤','外套','短袖','手套','帽子','卫衣','棒球服']
},
yAxis: {},
series: [{
name: '销量',
type: 'bar',
data: [5, 20, 36, 10, 10, 20,15,22,33,8,6,21,22,39]
}]
});
}
}
}
</script>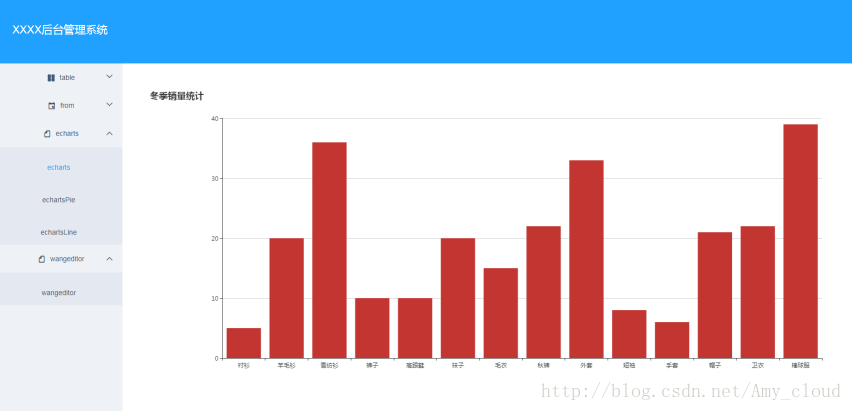
使用wangeditor
1.使用 npm下载 :
npm install wangeditor --save //(注意 wangeditor 全部是小写字母)2.在需要的地方引入:
<template>
    <div>
        <div id="editorElem" style="text-align:left"></div>
    </div>
</template>
<script>
import E from 'wangeditor'
export default {
name: 'editor',
data () {
return {
editorContent: ''
}
},
mounted() {
var editor = new E('#editorElem')
editor.customConfig.onchange = (html) => {
this.editorContent = html
}
editor.create()
}
}
</script>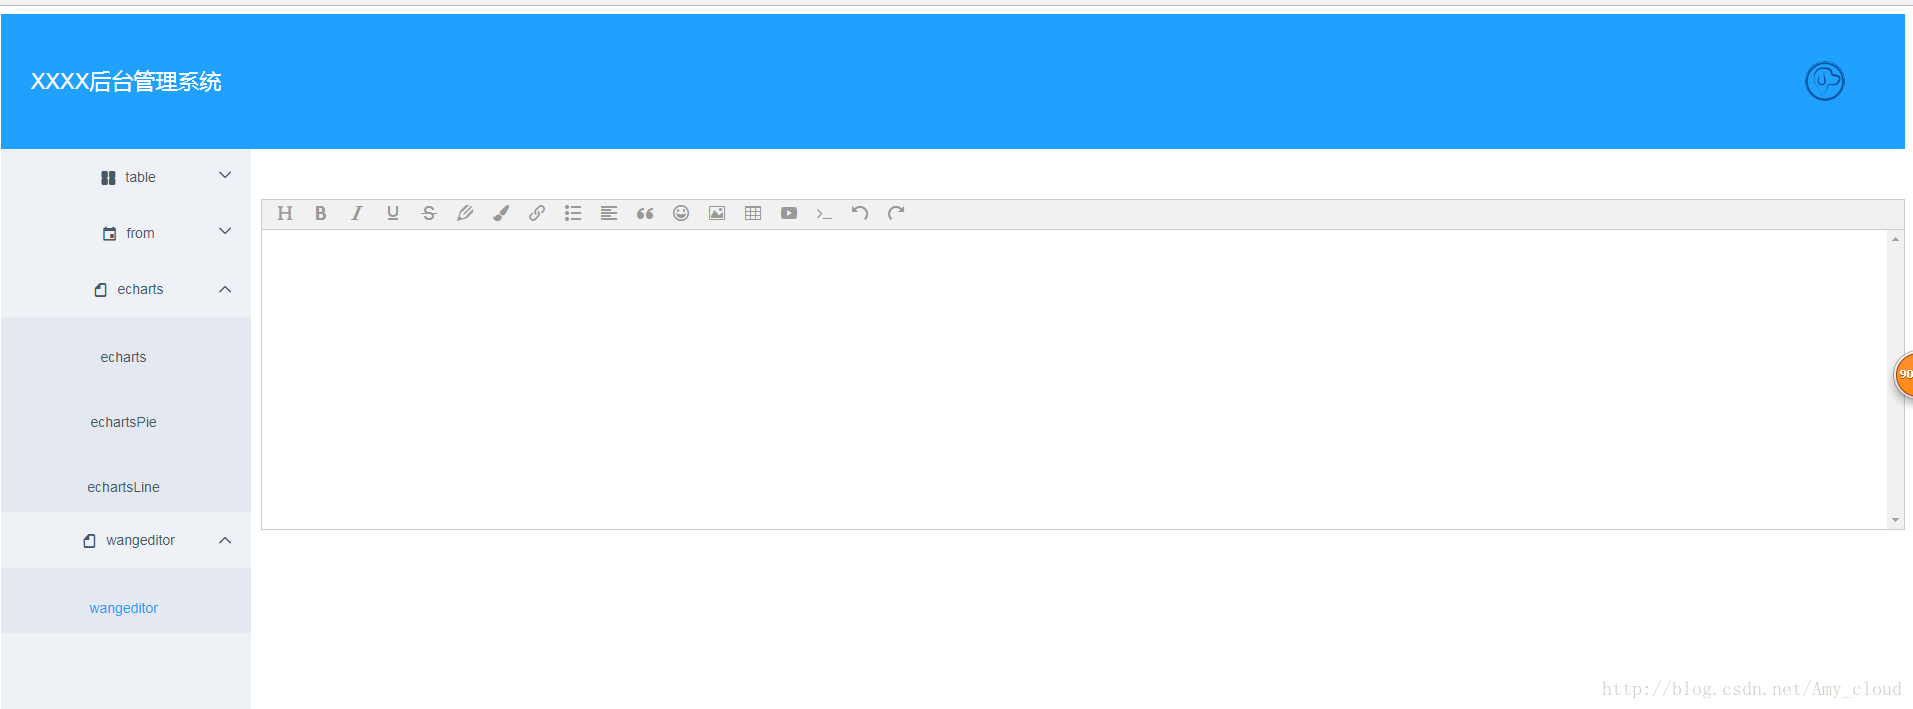


 592
592

 被折叠的 条评论
为什么被折叠?
被折叠的 条评论
为什么被折叠?
 到【灌水乐园】发言


