


获取更多R语言和生信知识,请关注公众号:医学和生信笔记。
公众号后台回复R语言,即可获得海量学习资料!
本篇主要介绍mlr3包的基本使用。
一个简单的机器学习流程在mlr3中可被分解为以下几个部分:
- 创建任务
比如回归、分裂、生存分析、降维、密度任务等等 - 挑选学习器(算法/模型)
比如随机森林、决策树、SVM、KNN等等 - 训练和预测
创建任务
本次示例将使用mtcars数据集创建一个回归任务,结果变量(或者叫因变量等等)是mpg。
# 首先加载数据
data("mtcars",package = "datasets")
data <- mtcars[,1:3]
str(data)
## 'data.frame':	32 obs. of  3 variables:
##  $ mpg : num  21 21 22.8 21.4 18.7 18.1 14.3 24.4 22.8 19.2 ...
##  $ cyl : num  6 6 4 6 8 6 8 4 4 6 ...
##  $ disp: num  160 160 108 258 360 ...
使用as_task_regr()创建回归任务,as_task_classif()可创建分类任务。
library(mlr3)

task_mtcars <- as_task_regr(data,target = "mpg",id="cars") # id是随便起一个名字
print(task_mtcars)
## <TaskRegr:cars> (32 x 3)
## * Target: mpg
## * Properties: -
## * Features (2):
##   - dbl (2): cyl, disp
可以看到数据以供32行,3列,target是mpg,feature是cyl和disp,都是bdl类型。
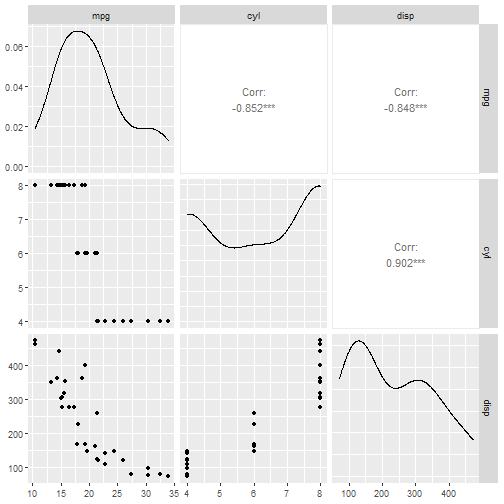
在创建模型前先探索数据:
library("mlr3viz") # 使用此包可视化数据
autoplot(task_mtcars, type = "pairs") # 基于GGally,我之前介绍过
## Registered S3 method overwritten by 'GGally':
##   method from
##   +.gg   ggplot2
如果你觉得每次加载1个R包很烦,可以直接使用library(mlr3verse)加载所有基础包!
如果你想使用自带数据集进行学习,此包也自带了很多流行的机器学习数据集。
查看内置数据集:
as.data.table(mlr_tasks)
##                key task_type nrow ncol properties lgl int dbl chr fct ord pxc
##  1: boston_housing      regr  506   19              0   3  13   0   2   0   0
##  2:  breast_cancer   classif  683   10   twoclass   0   0   0   0   0   9   0
##  3:  german_credit   classif 1000   21   twoclass   0   3   0   0  14   3   0
##  4:           iris   classif  150    5 multiclass   0   0   4   0   0   0   0
##  5:         mtcars      regr   32   11              0   0  10   0   0   0   0
##  6:       penguins   classif  344    8 multiclass   0   3   2   0   2   0   0
##  7:           pima   classif  768    9   twoclass   0   0   8   0   0   0   0
##  8:          sonar   classif  208   61   twoclass   0   0  60   0   0   0   0
##  9:           spam   classif 4601   58   twoclass   0   0  57   0   0   0   0
## 10:           wine   classif  178   14 multiclass   0   2  11   0   0   0   0
## 11:            zoo   classif  101   17 multiclass  15   1   0   0   0   0   0
结果很详细,给出了任务类型,行列数,变量类型等。
如果想要使用内置数据集,可使用以下代码:
task_penguin <- tsk("penguins")
print(task_penguin)
## <TaskClassif:penguins> (344 x 8)
## * Target: species
## * Properties: multiclass
## * Features (7):
##   - int (3): body_mass, flipper_length, year
##   - dbl (2): bill_depth, bill_length
##   - fct (2): island, sex
可以非常方便的取子集查看:
library("mlr3verse")
as.data.table(mlr_tasks)[, 1:4]
##                key task_type  nrow ncol
##  1:           actg      surv  1151   13
##  2:   bike_sharing      regr 17379   14
##  3: boston_housing      regr   506   19
##  4:  breast_cancer   classif   683   10
##  5:       faithful      dens   272    1
##  6:           gbcs      surv   686   10
##  7:  german_credit   classif  1000   21
##  8:          grace      surv  1000    8
##  9:           ilpd   classif   583   11
## 10:           iris   classif   150    5
## 11:     kc_housing      regr 21613   20
## 12:           lung      surv   228   10
## 13:      moneyball      regr  1232   15
## 14:         mtcars      regr    32   11
## 15:      optdigits   classif  5620   65
## 16:       penguins   classif   344    8
## 17:           pima   classif   768    9
## 18:         precip      dens    70    1
## 19:           rats      surv   300    5
## 20:          sonar   classif   208   61
## 21:           spam   classif  4601   58
## 22:        titanic   classif  1309   11
## 23:   unemployment      surv  3343    6
## 24:      usarrests     clust    50    4
## 25:           whas      surv   481   11
## 26:           wine   classif   178   14
## 27:            zoo   classif   101   17
##                key task_type  nrow ncol
支持非常多探索数据的操作:
task_penguin$ncol
## [1] 8
task_penguin$nrow
## [1] 344
task_penguin$feature_names
## [1] "bill_depth"     "bill_length"    "body_mass"      "flipper_length"
## [5] "island"         "sex"            "year"
task_penguin$feature_types
##                id    type
## 1:     bill_depth numeric
## 2:    bill_length numeric
## 3:      body_mass integer
## 4: flipper_length integer
## 5:         island  factor
## 6:            sex  factor`在这里插入代码片`
## 7:           year integer
task_penguin$target_names
## [1] "species"
task_penguin$task_type
## [1] "classif"
task_penguin$data()
##        species bill_depth bill_length body_mass flipper_length    island    sex
##   1:    Adelie       18.7        39.1      3750            181 Torgersen   male
##   2:    Adelie       17.4        39.5      3800            186 Torgersen female
##   3:    Adelie       18.0        40.3      3250            195 Torgersen female
##   4:    Adelie         NA          NA        NA             NA Torgersen   <NA>
##   5:    Adelie       19.3        36.7      3450            193 Torgersen female
##  ---
## 340: Chinstrap       19.8        55.8      4000            207     Dream   male
## 341: Chinstrap       18.1        43.5      3400            202     Dream female
## 342: Chinstrap       18.2        49.6      3775            193     Dream   male
## 343: Chinstrap       19.0        50.8      4100            210     Dream   male
## 344: Chinstrap       18.7        50.2      3775            198     Dream female
##      year
##   1: 2007
##   2: 2007
##   3: 2007
##   4: 2007
##   5: 2007
##  ---
## 340: 2009
## 341: 2009
## 342: 2009
## 343: 2009
## 344: 2009
task_penguin$head(3)
##    species bill_depth bill_length body_mass flipper_length    island    sex
## 1:  Adelie       18.7        39.1      3750            181 Torgersen   male
## 2:  Adelie       17.4        39.5      3800            186 Torgersen female
## 3:  Adelie       18.0        40.3      3250            195 Torgersen female
##    year
## 1: 2007
## 2: 2007
## 3: 2007
# 还有很多行列选择操作、改变变量的id(比如某个变量不参与模型训练)等多种操作
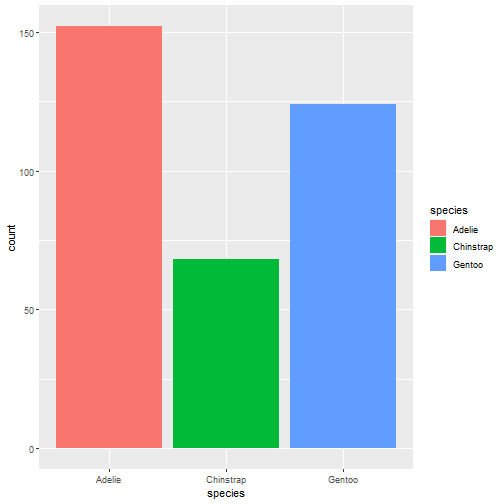
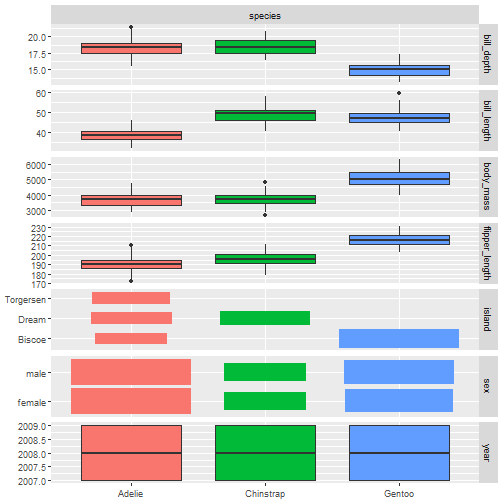
可视化数据:很多都是基于GGally包,可以看我之前的介绍
autoplot(task_penguin)
autoplot(task_penguin, type = "pairs")
## `stat_bin()` using `bins = 30`. Pick better value with `binwidth`.
## `stat_bin()` using `bins = 30`. Pick better value with `binwidth`.
## `stat_bin()` using `bins = 30`. Pick better value with `binwidth`.
## `stat_bin()` using `bins = 30`. Pick better value with `binwidth`.
## `stat_bin()` using `bins = 30`. Pick better value with `binwidth`.
## `stat_bin()` using `bins = 30`. Pick better value with `binwidth`.
## `stat_bin()` using `bins = 30`. Pick better value with `binwidth`.
## `stat_bin()` using `bins = 30`. Pick better value with `binwidth`.
## `stat_bin()` using `bins = 30`. Pick better value with `binwidth`.
## `stat_bin()` using `bins = 30`. Pick better value with `binwidth`.
## `stat_bin()` using `bins = 30`. Pick better value with `binwidth`.
## `stat_bin()` using `bins = 30`. Pick better value with `binwidth`.
## `stat_bin()` using `bins = 30`. Pick better value with `binwidth`.
## `stat_bin()` using `bins = 30`. Pick better value with `binwidth`.
## `stat_bin()` using `bins = 30`. Pick better value with `binwidth`.

autoplot(task_penguin, type = "duo")
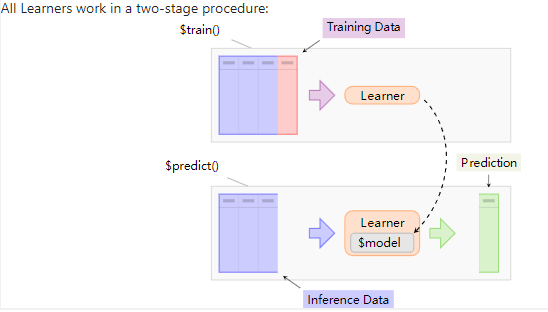
创建learner
所有的学习器都通过以下2个步骤工作:
mlr3verse只支持常见的学习器,比如随机森林、决策树、SVM、KNN等,如果想要查看所有的学习器,可以安装mlr3extralearners。
查看所有的支持的learner:
All learners
# 加载R包,常见的算法
library("mlr3verse")
mlr_learners
## <DictionaryLearner> with 53 stored values
## Keys: classif.cv_glmnet, classif.debug, classif.featureless,
##   classif.glmnet, classif.kknn, classif.lda, classif.log_reg,
##   classif.multinom, classif.naive_bayes, classif.nnet, classif.qda,
##   classif.ranger, classif.rpart, classif.svm, classif.xgboost,
##   clust.agnes, clust.ap, clust.cmeans, clust.cobweb, clust.dbscan,
##   clust.diana, clust.em, clust.fanny, clust.featureless, clust.ff,
##   clust.hclust, clust.kkmeans, clust.kmeans, clust.MBatchKMeans,
##   clust.meanshift, clust.pam, clust.SimpleKMeans, clust.xmeans,
##   dens.hist, dens.kde, regr.cv_glmnet, regr.debug, regr.featureless,
##   regr.glmnet, regr.kknn, regr.km, regr.lm, regr.ranger, regr.rpart,
##   regr.svm, regr.xgboost, surv.coxph, surv.cv_glmnet, surv.glmnet,
##   surv.kaplan, surv.ranger, surv.rpart, surv.xgboost
创建learner
# 决策树
learner = lrn("classif.rpart")
print(learner)
## <LearnerClassifRpart:classif.rpart>
## * Model: -
## * Parameters: xval=0
## * Packages: mlr3, rpart
## * Predict Type: response
## * Feature types: logical, integer, numeric, factor, ordered
## * Properties: importance, missings, multiclass, selected_features,
##   twoclass, weights
查看支持的超参数
learner$param_set
## <ParamSet>
##                 id    class lower upper nlevels        default value
##  1:             cp ParamDbl     0     1     Inf           0.01
##  2:     keep_model ParamLgl    NA    NA       2          FALSE
##  3:     maxcompete ParamInt     0   Inf     Inf              4
##  4:       maxdepth ParamInt     1    30      30             30
##  5:   maxsurrogate ParamInt     0   Inf     Inf              5
##  6:      minbucket ParamInt     1   Inf     Inf <NoDefault[3]>
##  7:       minsplit ParamInt     1   Inf     Inf             20
##  8: surrogatestyle ParamInt     0     1       2              0
##  9:   usesurrogate ParamInt     0     2       3              2
## 10:           xval ParamInt     0   Inf     Inf             10     0
一目了然,方便使用,记不住了可以看看,毕竟太多了,这一点比tidymodels贴心。
设定超参数的值
learner$param_set$values = list(cp = 0.01, xval = 0)
learner
## <LearnerClassifRpart:classif.rpart>
## * Model: -
## * Parameters: cp=0.01, xval=0
## * Packages: mlr3, rpart
## * Predict Type: response
## * Feature types: logical, integer, numeric, factor, ordered
## * Properties: importance, missings, multiclass, selected_features,
##   twoclass, weights
也可以在指定learner时设定
learner = lrn("classif.rpart", xval=0, cp = 0.001)
learner$param_set$values
## $xval
## [1] 0
##
## $cp
## [1] 0.001
训练、预测和性能评价
创建任务,选择模型
library("mlr3verse")

task = tsk("penguins") # 使用内置数据集
learner = lrn("classif.rpart") #决策树分类
划分训练集和测试集
spilt <- partition(task,ratio = 0.6, stratify = T)
spilt$train
##   [1]   2   3   4   5   7   8  10  11  12  14  15  16  17  19  23  25  26  27
##  [19]  28  30  31  33  34  36  37  40  42  45  46  48  50  51  53  56  59  60
##  [37]  61  62  64  66  67  68  69  71  73  75  78  82  83  84  88  89  91  94
##  [55]  96  97  99 100 101 102 104 107 108 113 114 115 118 120 121 123 125 126
##  [73] 127 128 129 130 131 132 133 135 136 137 138 139 142 143 145 149 150 151
##  [91] 152 154 156 157 159 160 163 169 170 171 172 173 175 176 179 180 181 182
## [109] 183 186 187 188 189 193 194 197 199 200 201 203 206 208 210 211 212 213
## [127] 214 215 216 218 219 220 222 223 224 225 226 228 229 230 233 236 237 239
## [145] 240 241 242 243 247 248 249 252 253 254 255 256 257 259 260 262 266 271
## [163] 272 273 274 277 279 280 285 288 290 291 293 294 295 296 297 299 300 301
## [181] 302 304 305 306 309 310 312 313 317 319 321 322 323 324 325 328 330 331
## [199] 332 334 337 338 339 340 341 342
训练模型
learner$train(task, row_ids = spilt$train)
print(learner$model)
## n= 206
##
## node), split, n, loss, yval, (yprob)
##       * denotes terminal node
##
## 1) root 206 115 Adelie (0.44174757 0.19902913 0.35922330)
##   2) flipper_length< 207.5 128  39 Adelie (0.69531250 0.30468750 0.00000000)
##     4) bill_length< 42.35 86   0 Adelie (1.00000000 0.00000000 0.00000000) *
##     5) bill_length>=42.35 42   3 Chinstrap (0.07142857 0.92857143 0.00000000) *
##   3) flipper_length>=207.5 78   4 Gentoo (0.02564103 0.02564103 0.94871795) *
预测
prediction <- learner$predict(task, row_ids = spilt$test)
print(prediction)
## <PredictionClassif> for 138 observations:
##     row_ids     truth  response
##           1    Adelie    Adelie
##           6    Adelie    Adelie
##           9    Adelie    Adelie
## ---
##         336 Chinstrap Chinstrap
##         343 Chinstrap    Gentoo
##         344 Chinstrap Chinstrap
混淆矩阵
prediction$confusion
##            truth
## response    Adelie Chinstrap Gentoo
##   Adelie        53         1      0
##   Chinstrap      8        24      2
##   Gentoo         0         2     48
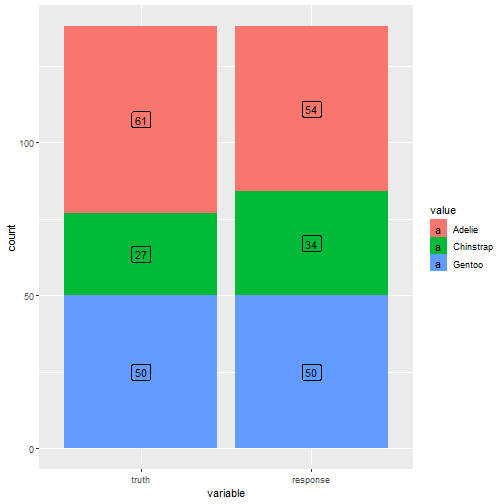
可视化
autoplot(prediction)
模型评价
先查看下支持的评价指标
mlr_measures
## <DictionaryMeasure> with 87 stored values
## Keys: aic, bic, classif.acc, classif.auc, classif.bacc, classif.bbrier,
##   classif.ce, classif.costs, classif.dor, classif.fbeta, classif.fdr,
##   classif.fn, classif.fnr, classif.fomr, classif.fp, classif.fpr,
##   classif.logloss, classif.mbrier, classif.mcc, classif.npv,
##   classif.ppv, classif.prauc, classif.precision, classif.recall,
##   classif.sensitivity, classif.specificity, classif.tn, classif.tnr,
##   classif.tp, classif.tpr, clust.ch, clust.db, clust.dunn,
##   clust.silhouette, clust.wss, debug, dens.logloss, oob_error,
##   regr.bias, regr.ktau, regr.mae, regr.mape, regr.maxae, regr.medae,
##   regr.medse, regr.mse, regr.msle, regr.pbias, regr.rae, regr.rmse,
##   regr.rmsle, regr.rrse, regr.rse, regr.rsq, regr.sae, regr.smape,
##   regr.srho, regr.sse, selected_features, sim.jaccard, sim.phi,
##   surv.brier, surv.calib_alpha, surv.calib_beta, surv.chambless_auc,
##   surv.cindex, surv.dcalib, surv.graf, surv.hung_auc, surv.intlogloss,
##   surv.logloss, surv.mae, surv.mse, surv.nagelk_r2, surv.oquigley_r2,
##   surv.rmse, surv.schmid, surv.song_auc, surv.song_tnr, surv.song_tpr,
##   surv.uno_auc, surv.uno_tnr, surv.uno_tpr, surv.xu_r2, time_both,
##   time_predict, time_train
这里我们选择accuracy
measure <- msr("classif.acc")
prediction$score(measure)
## classif.acc
##   0.9057971
选择多个指标:
measures <- msrs(c("classif.acc","classif.auc","classif.ce"))
prediction$score(measures)
## classif.acc classif.auc  classif.ce
##   0.9057971         NaN   0.0942029
对于简单的机器学习任务来说,mlr3真的是太方便了!4行代码即可搞定一个基本的流程!
获取更多R语言和生信知识,请关注公众号:医学和生信笔记。
公众号后台回复R语言,即可获得海量学习资料!


 3471
3471


 被折叠的 条评论
为什么被折叠?
被折叠的 条评论
为什么被折叠?
 到【灌水乐园】发言


