


You can collect performance data of any specific SQL action of an Application Engine program to address any performance issue.
您可以收集应用程序引擎程序的任何特定SQL操作的性能数据,以解决任何性能问题。
You can collect performance data of the SQL action, not any other action types.
可以收集SQL操作的性能数据,而不是任何其他操作类型的性能数据。
You cannot collect performance data of Application Engine programs called using the CallAppEngine() function.
不能收集使用CallAppEngine()函数调用的应用程序引擎程序的性能数据。
This section discusses how to:
本节讨论如何:
- Set options in Configuration Manager.
- 在配置管理器中设置选项。
- Set options in domain configuration files (three-tier mode).
- 在域配置文件中设置选项(三层模式)。
- Configure performance data collection in PeopleSoft Internet Architecture (PIA).
- 在PeopleSoft互联网架构(PIA)中配置性能数据收集。
Setting Options in PeopleSoft Configuration Manager (two-tier mode)
在PeopleSoft配置管理器中设置选项(两层模式)
You can enable performance data collection using the Trace tab in PeopleSoft Configuration Manager.
您可以使用PeopleSoft Configuration Manager中的Trace选项卡启用性能数据收集。
To enable performance data collection (two-tier mode):
要启用性能数据收集(两层模式):
- Open Configuration Manager.
打开配置管理器。
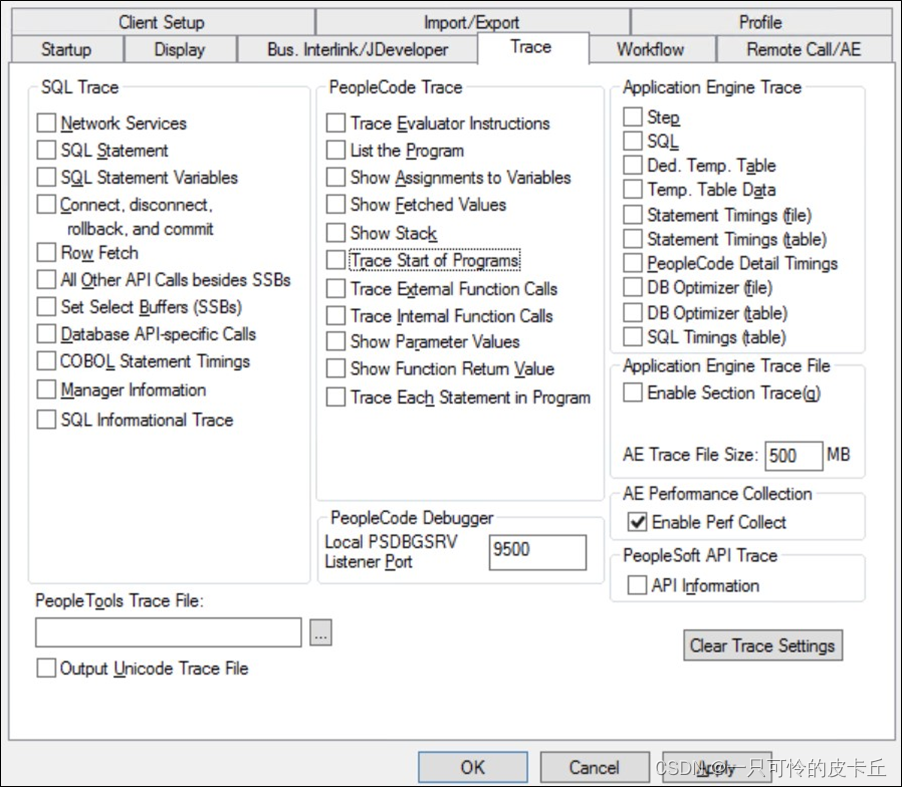
- Click the Trace tab.
单击“跟踪”选项卡。
- Select the Enable Perf Collect check box.
选中“启用Perf Collect”复选框。
- Click either the Apply or OK button to enable the option.
单击“应用”或“确定”按钮以启用该选项。
The below image shows the Application Engine Performance Collection option:
下图显示了“应用程序引擎性能收集”选项:
This procedure is valid only if you are running Application Engine programs on a Microsoft Windows workstation in a development environment.
只有在开发环境中的Microsoft Windows工作站上运行应用程序引擎程序时,此过程才有效。
Setting Options in Domain Configuration Files (three-tier mode)
在域配置文件中设置选项(三层模式)
You can enable performance data collection in domain configuration files of PeopleSoft Process Scheduler Administration.
您可以在PeopleSoft Process Scheduler Administration的域配置文件中启用性能数据收集。
To set options in domain configuration files (three-tier mode):
要在域配置文件中设置选项(三层模式):
- Navigate to the process scheduler configuration file.
导航到进程调度程序配置文件。
- Under the Trace category, set TraceAEEnablePerfCollect to Y.
在Trace类别下,将TraceAEEnablePerfCollect设置为Y。
This procedure is valid for Application Engine programs on Microsoft Windows and UNIX/LINUX systems.
此过程对微软Windows和UNIX/LINUX系统上的应用程序引擎程序有效。
Configuring Performance Data Collection
配置性能数据收集
You can configure performance data collection of a specific SQL action using the AE Additional Setup page.
您可以使用AE附加设置页面配置特定SQL操作的性能数据收集。
To configure performance data collection:
配置性能数据收集:
- Navigate to PeopleTools, Application Engine, AE Enhanced Performance Trace.
导航到PeopleTools、应用程序引擎、AE增强性能跟踪。
- Search for the Application Engine program.
搜索应用程序引擎程序。
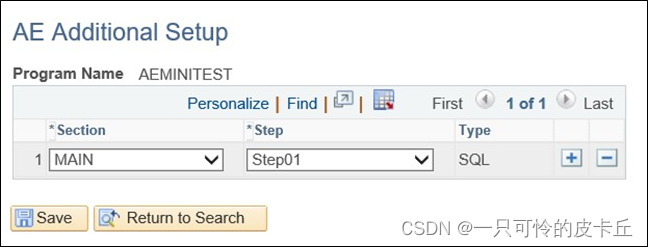
- On the AE Additional Setup page, enter the configuration detail, such as the section and step name of the specific SQL action.
在AE Additional Setup页面上,输入配置详细信息,例如特定SQL操作的部分和步骤名称。
Note: Other action types, such as PeopleCode, will not be displayed on this page as you can only collect performance data for SQL actions.
附注:其他操作类型(如PeopleCode)将不会显示在此页面上,因为您只能收集SQL操作的性能数据。
The example below illustrates the configuration detail to capture performance data of a specific SQL action:
下面的示例说明了捕获特定SQL操作的性能数据的配置细节:
As part of performance data collection, a new table PSAESQLTIMINGS gets created to store performance data for specific SQL actions. The table includes Application Engine process instance, run control ID, rows affected, start time, end time, and SQLID.
作为性能数据收集的一部分,将创建一个新表PSAESQLTIMINGS来存储特定SQL操作的性能数据。该表包括Application Engine流程实例、运行控制ID、受影响的行、开始时间、结束时间和SQLID。
Note: Performance data of SQL actions will be inserted in the PSAESQLTIMINGS table when the Application Engine ends successfully.
附注:当应用程序引擎成功结束时,SQL操作的性能数据将插入PSAESQLTIMINGS表中。
You can use the SQLID data to query the database system table to get further information. SQLID data is available only for Oracle databases.
您可以使用SQLID数据查询数据库系统表,以获得进一步的信息。SQLID数据仅适用于甲骨文数据库。
Related Links
Application Engine Call Structure
相关链接应用引擎调用结构
Locating Trace Files
定位跟踪文件
Locating a generated trace file depends on how you invoked the program and the operating system on which the program runs. This table describes trace file locations based on where the program initiated:
查找生成的跟踪文件取决于调用程序的方式以及运行该程序的操作系统。此表根据程序启动的位置描述跟踪文件的位置:
| Location Where the Program Was Initiated | Trace File Location |
| Microsoft Windows workstation | Look for the trace file in %TEMP%\PS\<db name>. |
| PeopleCode | Look for the trace file in %TEMP%\PS\db_name on Microsoft Windows NT and in PS_CFG_HOME/log/\<db name> on UNIX and Linux systems. |
| Command line | Look for the trace file in the directory specified in the Log/ Output field in the PS_SERVER_CFG file. |
| PeopleSoft Process Scheduler | Look for the trace file in a subdirectory of the directory specified in the Log/Output field in the PS_SERVER_CFG file. |
The Application Engine names the trace files according to the following naming convention:
- When a program includes a process instance, the trace file name is AE_Program_name_Process_Instance_Date/Time_Stamp.AET. For example, AE_AEMINITEST_99_0506050320.AET.
- When a program does not include a process instance, the trace file name is AE_Date/ Time_Stamp_OS_PID.AET.
- When Application Engine is run online, the trace file name is OprID_Hostname_Date/ Time_Stamp.AET. For example, PTDMO_SLC00FCJ_0507230158.AET.
The date and time stamp is in the format <month><day><hour><minute><second>, with two values for each date element and no punctuation between the elements. For example, August 12 at 5:09 p.m. and 30 seconds would be 0812170930.
Note: For an Application Engine program running on a server, PeopleTools writes the generic PeopleTools trace for SQL and PeopleCode trace files to the same directories as the AET traces. The prefix of the trace file name is also the same, and the suffix is trc. On a Windows workstation, the system writes the trace to the file specified in thePeople Tools Trace File field on the Trace tab of PeopleSoft Configuration Manager.


 620
620


 被折叠的 条评论
为什么被折叠?
被折叠的 条评论
为什么被折叠?
 到【灌水乐园】发言


