


目录
参考
Linux之core dumped出错原因及位置分析
ubuntu20.4无法生成core文件如何解决
什么是段错误
当程序运行的过程中异常终止或崩溃,操作系统会将程序当时的内存状态记录下来,保存在一个文件中,这种行为就叫做Core Dump(中文有的翻译成“核心转储”)。我们可以认为 core dump 是“内存快照”,但实际上,除了内存信息之外,还有些关键的程序运行状态也会同时 dump 下来,例如寄存器信息(包括程序指针、栈指针等)、内存管理信息、其他处理器和操作系统状态和信息。core dump 对于编程人员诊断和调试程序是非常有帮助的,因为对于有些程序错误是很难重现的,例如指针异常,而 core dump 文件可以再现程序出错时的情景。
Segmentation fault (core dumped)多为内存不当操作造成。空指针、野指针的读写操作,数组越界访问,破坏常量等。如对链表的新增和释放包括赋值等等,如出现不当操作都有可能造成程序崩溃。对每个指针声明后进行初始化为NULL是避免这个问题的好办法。排除此问题的最好办法则是调试。
开启生成core文件
查看core文件限制
在终端中输入命令ulimit -c,输出的结果为 0,说明默认是关闭 core dump 的,即当程序异常终止时,也不会生成 core dump 文件。
我们可以使用命令ulimit -c unlimited来开启 core dump 功能,并且不限制 core dump 文件的大小; 如果需要限制文件的大小,将 unlimited 改成你想生成 core 文件最大的大小,注意单位为 blocks(KB)。
root@sony-HP-Notebook:/etc# ulimit -a
core file size          (blocks, -c) unlimited
data seg size           (kbytes, -d) unlimited
scheduling priority             (-e) 0
file size               (blocks, -f) unlimited
pending signals                 (-i) 15008
max locked memory       (kbytes, -l) 65536
max memory size         (kbytes, -m) unlimited
open files                      (-n) 1024
pipe size            (512 bytes, -p) 8
POSIX message queues     (bytes, -q) 819200
real-time priority              (-r) 0
stack size              (kbytes, -s) 8192
cpu time               (seconds, -t) unlimited
max user processes              (-u) 15008
virtual memory          (kbytes, -v) unlimited
file locks                      (-x) unlimited
注意:这样修改只能针对当前控制台生效,关闭再打开新的控制台无效,所以如果用用就是设置参考如下
永久设置core文件限制
或者vim /etc/profile在最后增加ulimit -c unlimited,然后source /etc/profile即可生效
开启core文件路径
修改配置文件
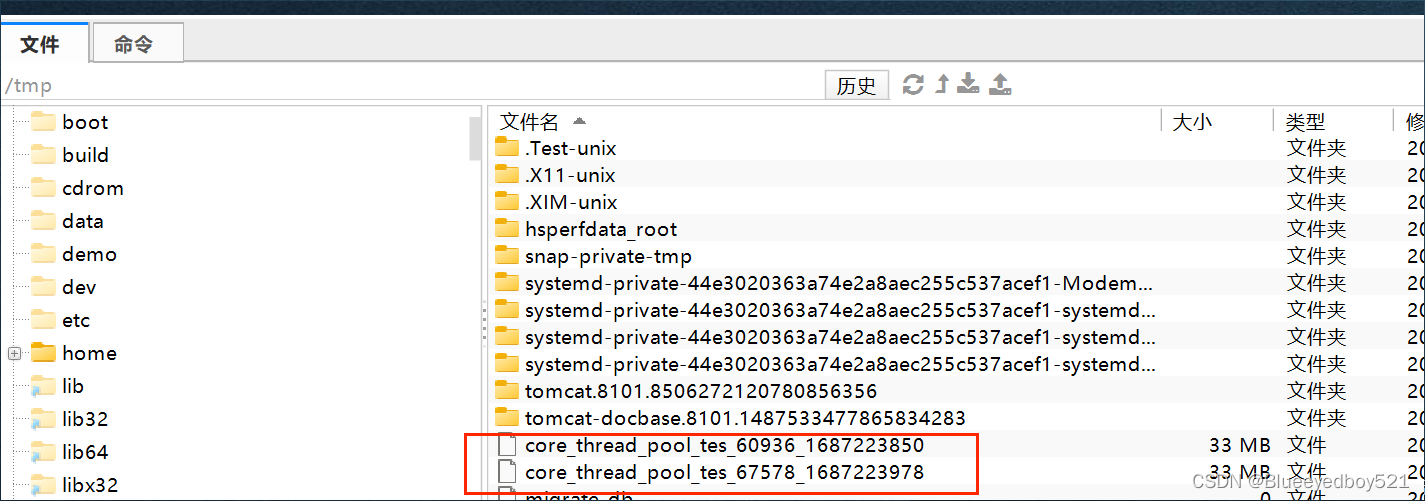
修改/proc/sys/kernel/core_pattern文件,保存到tmp目录下
vim /proc/sys/kernel/core_pattern
# 添加如下
/tmp/core_%e_%p_%t
其中命名参数含义如下:
- %e:文件名
- %p:进程号
- %t:unix时间
关闭abort
# 关闭apport.service服务,这时可以关闭apport.service这个服务

sudo systemctl disable apport.service

# 如果这个命令无法关闭的话,可以修改/etc/default/apport文件,将enable改成0

vi /etc/default/apport
运行生成core文件
运行
运行测试程序,如果出现一下核心已转存
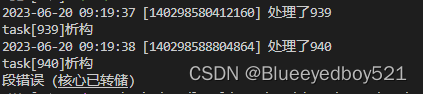
段错误
gdb调试
将段错误拷贝到与执行程序同一个目录
gdb调试
- 先用gdb 程序 core文件运行
- 使用where命令查看段错误位置
root@sony-HP-Notebook:/usr/local/cpp_demo/thread# gdb thread_pool_test core_thread_pool_tes_67578_1687223978
GNU gdb (Ubuntu 9.2-0ubuntu1~20.04) 9.2
Copyright (C) 2020 Free Software Foundation, Inc.
License GPLv3+: GNU GPL version 3 or later <http://gnu.org/licenses/gpl.html>
This is free software: you are free to change and redistribute it.
There is NO WARRANTY, to the extent permitted by law.
Type "show copying" and "show warranty" for details.
This GDB was configured as "x86_64-linux-gnu".
Type "show configuration" for configuration details.
For bug reporting instructions, please see:
<http://www.gnu.org/software/gdb/bugs/>.
Find the GDB manual and other documentation resources online at:
    <http://www.gnu.org/software/gdb/documentation/>.

For help, type "help".
Type "apropos word" to search for commands related to "word"...
Reading symbols from thread_pool_test...

warning: core file may not match specified executable file.
[New LWP 67582]
[New LWP 67579]
[New LWP 67578]
[New LWP 67580]
[New LWP 67581]
[Thread debugging using libthread_db enabled]
Using host libthread_db library "/lib/x86_64-linux-gnu/libthread_db.so.1".
--Type <RET> for more, q to quit, c to continue without paging--c
Core was generated by `./thread_pool_test'.
Program terminated with signal SIGSEGV, Segmentation fault.
#0  0x00007f99d04ea4fa in std::_Rb_tree_insert_and_rebalance(bool, std::_Rb_tree_node_base*, std::_Rb_tree_node_base*, std::_Rb_tree_node_base&) () from /lib/x86_64-linux-gnu/libstdc++.so.6
[Current thread is 1 (Thread 0x7f99ce8c3700 (LWP 67582))]
(gdb) where
#0  0x00007f99d04ea4fa in std::_Rb_tree_insert_and_rebalance(bool, std::_Rb_tree_node_base*, std::_Rb_tree_node_base*, std::_Rb_tree_node_base&) () from /lib/x86_64-linux-gnu/libstdc++.so.6
#1  0x000055909c4077a1 in std::_Rb_tree<int, int, std::_Identity<int>, std::less<int>, std::allocator<int> >::_M_insert_<int const&, std::_Rb_tree<int, int, std::_Identity<int>, std::less<int>, std::allocator<int> >::_Alloc_node> (this=0x55909c40d060 <sg_data>, __x=0x0, __p=0x7f99c8003d40, __v=@0x55909d540090: 941, __node_gen=...) at /usr/include/c++/9/bits/stl_tree.h:1817
#2  0x000055909c407220 in std::_Rb_tree<int, int, std::_Identity<int>, std::less<int>, std::allocator<int> >::_M_insert_unique<int const&> (this=0x55909c40d060 <sg_data>, __v=@0x55909d540090: 941)
    at /usr/include/c++/9/bits/stl_tree.h:2158
#3  0x000055909c406ed0 in std::set<int, std::less<int>, std::allocator<int> >::insert (this=0x55909c40d060 <sg_data>, __x=@0x55909d540090: 941) at /usr/include/c++/9/bits/stl_set.h:511
#4  0x000055909c4068d8 in CustomTask::run (this=0x55909d540080) at thread_pool_test.cpp:41
#5  0x000055909c402e51 in edevp::thread::Worker::run (this=0x55909d536af0) at worker.cpp:70
#6  0x000055909c4029ff in edevp::thread::Thread::threadFunc (ptr=0x55909d536af0) at thread.cpp:29
#7  0x00007f99d0612609 in start_thread (arg=<optimized out>) at pthread_create.c:477
#8  0x00007f99d033a163 in clone () at ../sysdeps/unix/sysv/linux/x86_64/clone.S:95
如上定位到是thread_pool_test.cpp:41,中调用set的insert的时候报错,进一步排查代码发现,是因为多并发操作set导致异常,修改代码加锁
// 加锁
            pthread_mutex_lock(&mutex);
            sg_data.insert(m_index);
            // 解锁
            pthread_mutex_unlock(&mutex);


 4万+
4万+


 被折叠的 条评论
为什么被折叠?
被折叠的 条评论
为什么被折叠?
 到【灌水乐园】发言


