


包含全部示例的代码仓库见GIthub
1 导入库
import matplotlib.pyplot as plt
import numpy as np
2 面向对象绘图
示例1
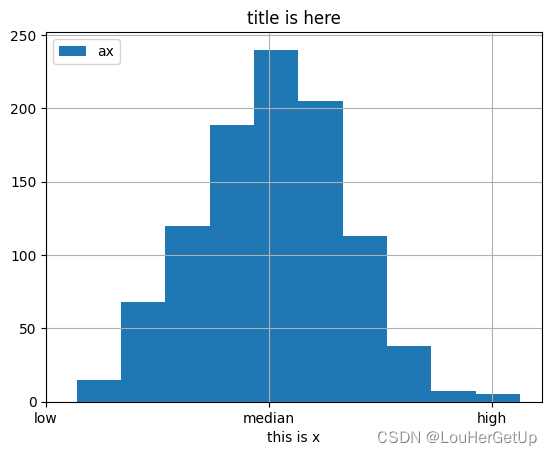
data = np.random.randn(1000)
fig, ax = plt.subplots()
ax.hist(data, label='ax')  # 默认分成10份
ax.set_title('title is here')
ax.set_xlabel('this is x')
ax.legend(loc=2)
ax.set_xticks([-3,0,3]) # 第二个列表不写,则只显示[-3,0,3]
ax.set_xticklabels(['low', 'median', 'high'])
# ax.set_xticks([-3,0,3], ['low', 'median', 'high'])
ax.grid(True)
fig, ax = plt.subplots(2,2,figsize=(10,8))
ax[0][0].hist(data)
ax[0][1].boxplot(data)
plt.tight_layout()  # 让多个图像显示的不那么拥挤
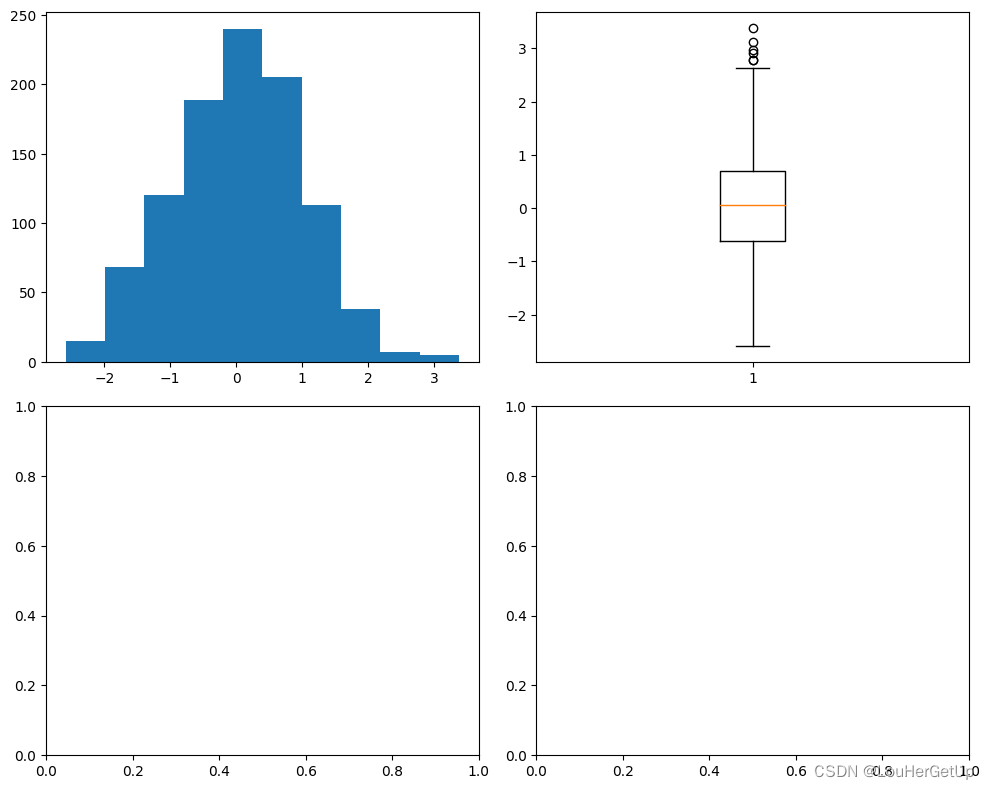
np.shape(ax)
# output
(2, 2)


 2391
2391


 被折叠的 条评论
为什么被折叠?
被折叠的 条评论
为什么被折叠?
 到【灌水乐园】发言


