


文章目录
前言
本文就快速搭建一个基于Prometheus+SpringBoot+Grafana的基本监控,主要在于帮助刚接触的同学,能够快速熟悉,能够对Prometheus+SpringBoot+Grafana有一个感官上的认识。
一、Prometheus下载、启动
为了方便快速上手,我们直接使用windows版本,点击即可下载:prometheus-2.4.3.windows-amd64.tar.gz。
下载完成后,可直接运行:prometheus.exe

表示启动成功

启动成功后,可直接在浏览器访问:http://localhost:9090/

二、SpringBoot
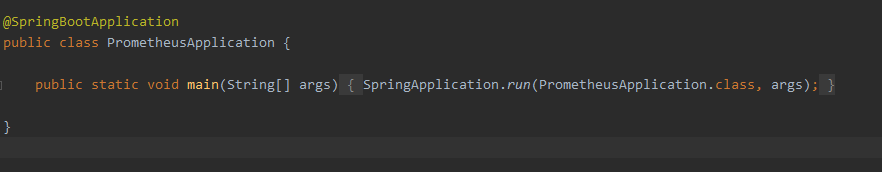
1.快速构建
Actuator主要可以通过Micrometer来暴露一些SpringBoot应用的信息,再配合Prometheus可以轻松的抓取Micrometer暴露出来的数据。

2.启动服务
服务启动后,actuator默认就是使用服务的端口,地址/actuator,所以我们直接访问http://localhost:8080/actuator即可

3.暴露端点
安全起见,默认只暴露一个health端点,你也可以通过配置来控制需要暴露和隐藏的端点。
比如像下面这样,除了health,metrics端点不暴露,其他的端点全部都暴露出来
management.endpoints.web.exposure.include=*
management.endpoints.web.exposure.exclude=health,metrics

如果想看更详细一点的信息,还可以加上如下配置
management.endpoint.health.show-details=always
4.更换Actuator地址和端口
当然,Actuator也支持修改默认端口号和地址。
management.server.port=8090
management.endpoints.web.base-path=/myActuator
现在访问http://localhost:8090/myActuator

三、整合Prometheus
1.添加jar包
SpringBoot支持通过Micrometer来提供标准的监控指标暴露方式,所以SpringBoot整合Prometheus只需要简单的添加一下jar包即可
<dependency>
    <groupId>io.micrometer</groupId>
    <artifactId>micrometer-registry-prometheus</artifactId>
</dependency>
添加完以后,我们重启服务,再访问,可以看到多了一个prometheus端点

2.访问服务,查看端点信息
访问http://localhost:8090/myActuator/prometheus可以看到有很多信息,

3.配置Prometheus.yaml文件
# my global config
global:
  scrape_interval:     15s # Set the scrape interval to every 15 seconds. Default is every 1 minute.
  evaluation_interval: 15s # Evaluate rules every 15 seconds. The default is every 1 minute.
  # scrape_timeout is set to the global default (10s).

# Alertmanager configuration
alerting:
  alertmanagers:
  - static_configs:
    - targets:
      # - alertmanager:9093

# Load rules once and periodically evaluate them according to the global 'evaluation_interval'.
rule_files:
  # - "first_rules.yml"
  # - "second_rules.yml"

# A scrape configuration containing exactly one endpoint to scrape:
# Here it's Prometheus itself.
scrape_configs:
  # The job name is added as a label `job=<job_name>` to any timeseries scraped from this config.
  #- job_name: 'prometheus'

    # metrics_path defaults to '/metrics'
    # scheme defaults to 'http'.

    #static_configs:
    #- targets: ['localhost:9090']

  - job_name: 'my_prometheus'
    metrics_path: '/myActuator/prometheus'
    static_configs:
    - targets: ['localhost:8090']
4.访问Prometheus查看端点信息

四、整合Grafana
1.下载、安装
点击下载:Grafana 5.3.2 for Windows
2.启动
解压后,进入\grafana-5.3.2\bin目录,然后运行grafana-server.exe
3.访问
直接访问http://localhost:3000/,账号密码默认都是admin

4.配置数据源


5.添加Dashboard


当前,由于后台服务没有任何请求,所以没有数据产生,我们随便添加一次后台请求,然后访问几次再看。
@RestController
@RequestMapping("/order")
public class OrderController {

    @RequestMapping("/queryOrder")
    public void queryOrder(){

    }

}
可以先直接查看Prometheus,已经有相关数据产生了

再回到Grafana上,直接填入端点信息,Grafana即可帮我们绘制出图标信息。

总结
SpringBoot Actuator提供了通过HTTP端点来监控应用程序的各种指标,Prometheus提供了更为丰富的指标收集与存储方式,而Mircometer框架就类似于SLF4J,它是应用指标方面的门面框架,使得客户端不用关心提供指标项的具体来源。


 3061
3061


 被折叠的 条评论
为什么被折叠?
被折叠的 条评论
为什么被折叠?
 到【灌水乐园】发言


