


方法1
参数:subplots=True
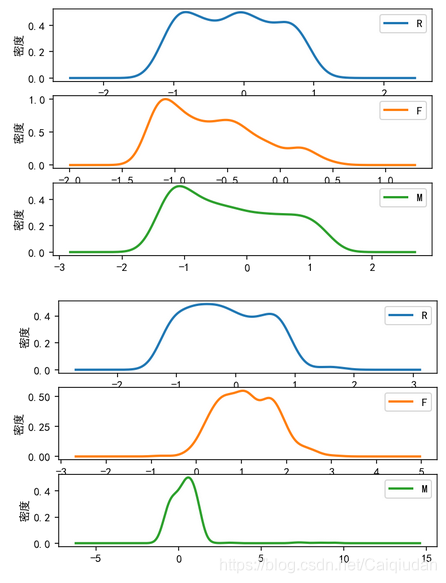
def density_plot(data):
    import matplotlib.pyplot as plt
    p = data.plot(kind='kde', linewidth=2, subplots=True, sharex=False) # subplots=True
    [p[i].set_ylabel('密度') for i in range(k)]
    plt.legend()
for i in range(k):
    density_plot(data[r['聚类类别'] == i])
方法2
fig, axarr = plt.subplots(1, 2)
axarr[0].set_title('x')
axarr[0].imshow(x[0,:,:,0])
axarr[1].set_title('x_pad')
axarr[1].imshow(x_pad[0,:,:,0])


 1331
1331


 被折叠的 条评论
为什么被折叠?
被折叠的 条评论
为什么被折叠?
 到【灌水乐园】发言


