


依赖包
一般情况下,直接使用
import matplotlib.pyplot as plt
如果报错的话,需要进行说明,使用如下导包结构
import matplotlib
import matplotlib.pyplot as plt
matplotlib.use('TkAgg')
需要中文显示的,需要在代码之前设置一下
# 用来正常显示中文标签
plt.rcParams['font.sans-serif'] = ['SimHei']
# 用来正常显示负号
plt.rcParams['axes.unicode_minus'] = False
柱状图
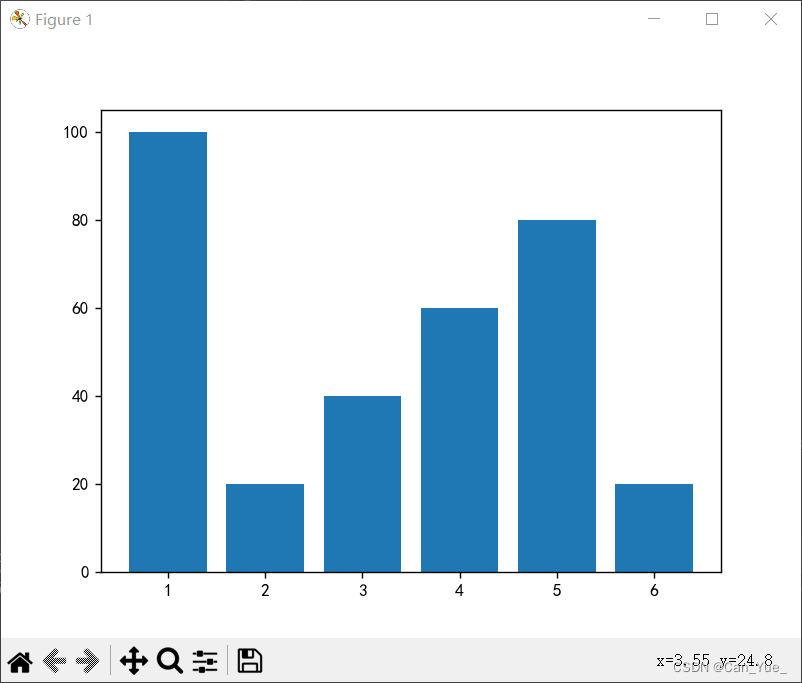
简单柱状图
# 简单柱状图
x = [1, 2, 3, 4, 5, 6]
y = [100, 20, 40, 60, 80, 20]
plt.bar(x, y)
plt.show()
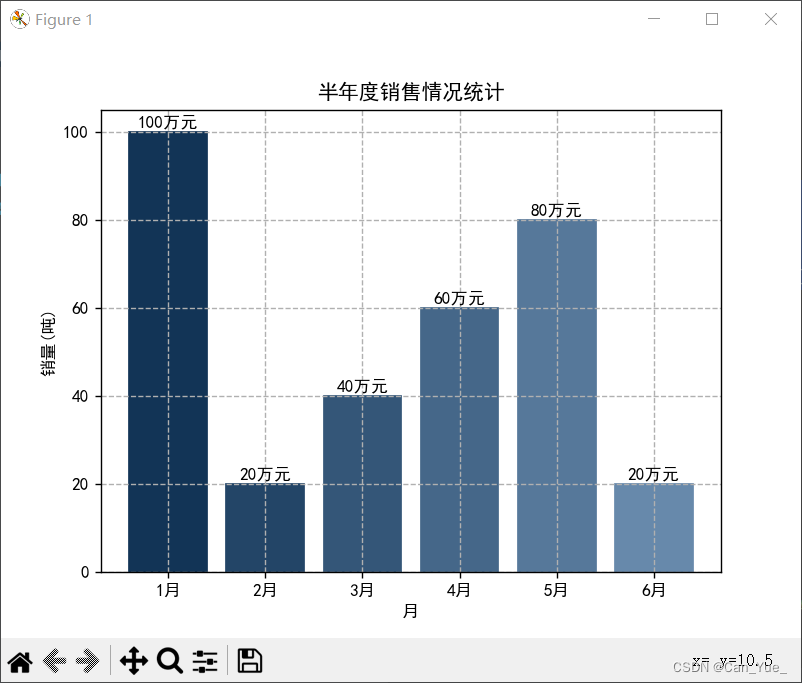
使用对象方式设置参数画柱状图
# 使用对象方式设置参数画柱状图
x = [1, 2, 3, 4, 5, 6]  # 刻度值
y = [100, 20, 40, 60, 80, 20]
xLabel = ['1月', '2月', '3月', '4月', '5月', '6月']
colors = ['#123456', '#234567', '#345678', '#456789', '#56789A', '#6789AB']  # RGB
ax = plt.subplot()
ax.set_xticks(x)
ax.set_xticklabels(xLabel)
ax.set_xlabel("月")
ax.set_ylabel("销量(吨)")
bars = ax.bar(x, y)  # 获取每个柱体对象
for bar, color in zip(bars, colors):
    bar.set_color(color)
    pass
for x1, y1 in zip(x, y):
    plt.text(x1, y1+0.5, str(y1)+"万元", ha='center', va='bottom')
    pass
plt.title("半年度销售情况统计")
plt.grid(linestyle="--")  # 设置网格
plt.show()
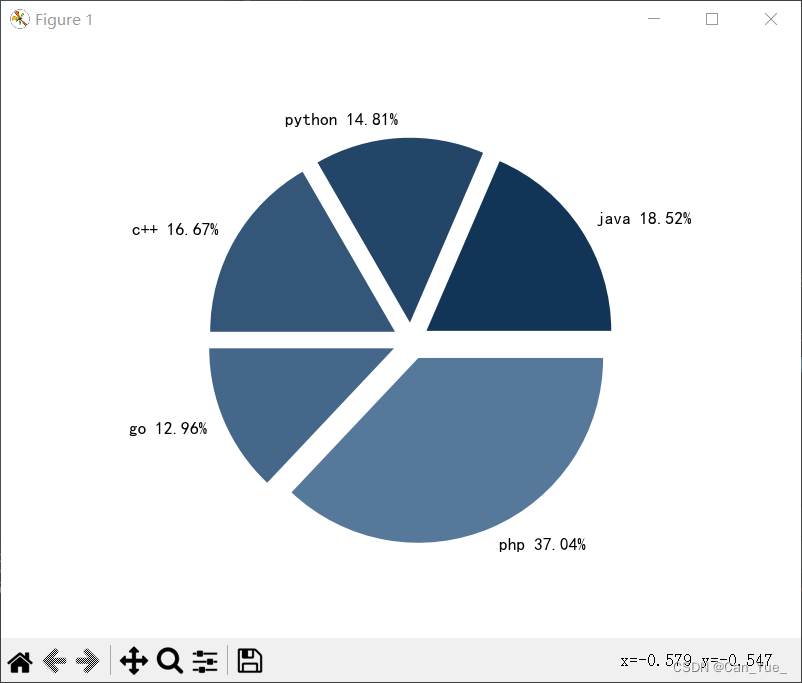
饼状图
# 绘制饼状图
x = np.array([100, 80, 90, 70, 200])
percent = x/np.sum(x)
colors = ['#123456', '#234567', '#345678', '#456789', '#56789A']  # RGB
labels = ['java', 'python', 'c++', 'go', 'php']
labels = ["%s %.2f%%" % (t, p*100) for t, p in zip(labels, percent)]
plt.pie(x, colors=colors, labels=labels, explode=[0.1, 0.1, 0.1, 0.1, 0.1])
plt.show()
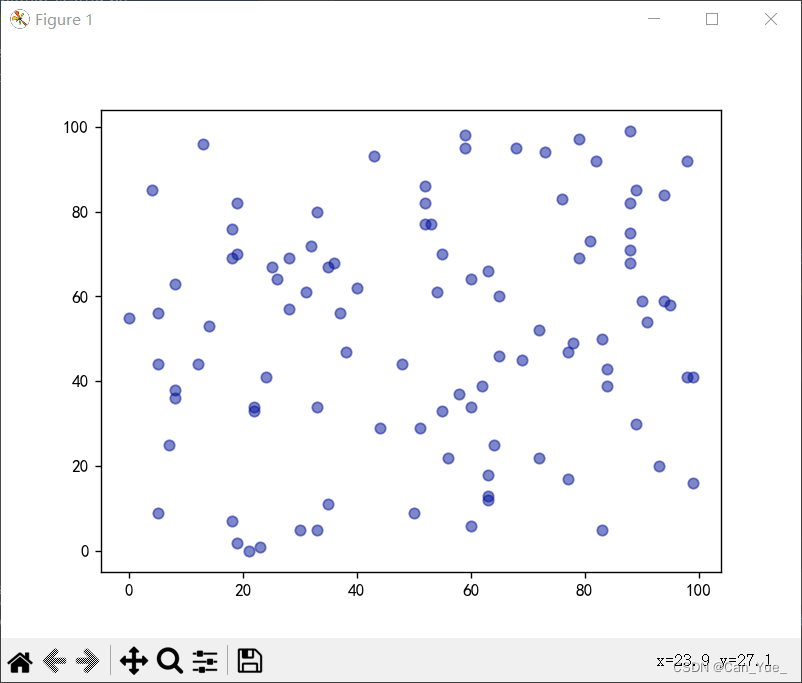
散点图
# 绘制散点图
points = np.random.randint(0, 100, size=(100, 2))
plt.scatter(x=points[:, 0], y=points[:, 1], alpha=0.5, c="#001199", marker="o")
plt.show()


 7980
7980


 被折叠的 条评论
为什么被折叠?
被折叠的 条评论
为什么被折叠?
 到【灌水乐园】发言


