


- Python 程序测试
profile 和 Cprofile
- profile模块的性能相对较低
- profile模块在跨平台性方面更好
- cProfile模块是基于C语言的性能分析器
- cProfile是Python默认的性能分析器,比profile模块具有更好的性能
namespace
- namespace是一种用于组织和管理标识符(例如变量、函数、类等)的机制。它提供了一种避免命名冲突和隔离标识符的方式,其中每个标识符都有一个唯一的名称。
- Global Namespace
- Local Namespace
- Built-in Namespace
- 内置命名空间在程序启动时自动加载,并且一直存在于程序的整个执行过程中
- 内置命名空间包含了编程语言的内置函数和类型
profile 常用方法简介与案例
run(statement, filename=None, sort=None)
- 运行指定的代码并进行性能分析(类似eval函数)
- 通过指定filename来将结果保存到文件中(二进制),可以通过sort参数来指定排序方式
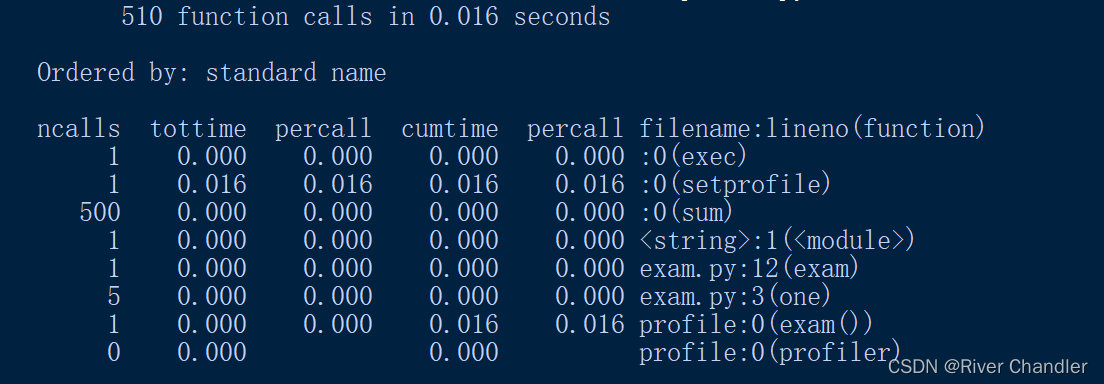
- 分析报告中的每一行都对应一个函数或方法的统计信息。
- 分析报告还提供了一些额外的信息,如每个函数调用的层级关系、递归深度
- 分析报告的输出包含以下几个部分
- ncalls: 表示函数被调用的次数
- tottime: 表示函数的总执行时间(不包括子函数的执行时间)
- percall: 表示函数平均执行时间
- cumtime: 表示函数及其所有子函数的总执行时间
- percall: 表示函数及其所有子函数的平均执行时间
- filename: 表示函数所在的文件名
- lineno: 表示函数定义所在的行号
- function: 表示函数名。
import profile

def one():
    a = [1,2,3,4]
    for _ in range(10):
        b = set(a)
        a += a
    S = 0
    for _ in range(100):
        S += sum(b)

def exam():
    for _ in range(5):
        one()

if __name__ == '__main__':
    profile.run('exam()')
import profile

def one():
    a = [1,2,3,4]
    for _ in range(10):
        b = set(a)
        a += a
    S = 0
    for _ in range(100):
        S += sum(b)

def two(n):
    if n==100:
        return 0
    elif n>200:
        return -1
    else:
        two(n+1)

def exam():
    for _ in range(5):
        one()
        two(0)


if __name__ == '__main__':
    profile.run('exam()')
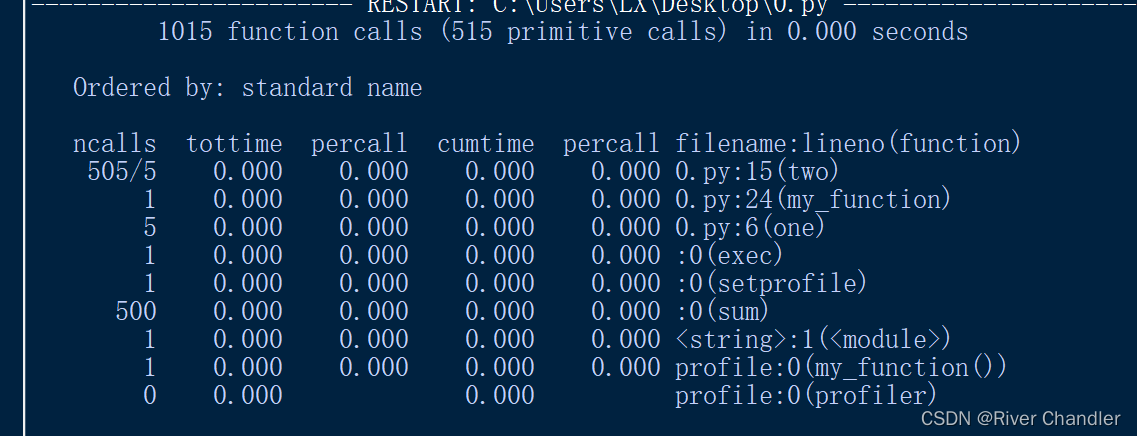
1015 function calls (515 primitive calls) in 0.016 seconds
Ordered by: standard name
ncalls tottime percall cumtime percall filename:lineno(function)
1 0.000 0.000 0.016 0.016 :0(exec)
1 0.000 0.000 0.000 0.000 :0(setprofile)
500 0.000 0.000 0.000 0.000 :0(sum)
1 0.000 0.000 0.016 0.016 <string>:1(<module>)
505/5 0.000 0.000 0.000 0.000 exam.py:12(two)
1 0.000 0.000 0.016 0.016 exam.py:20(exam)
5 0.016 0.003 0.016 0.003 exam.py:3(one)
1 0.000 0.000 0.016 0.016 profile:0(exam())
0 0.000 0.000 profile:0(profiler)
runctx
import cProfile
import pstats
import profile


def one():
    a = [1,2,3,4]
    for _ in range(10):
        b = set(a)
        a += a
    S = 0
    for _ in range(100):
        S += sum(b)

def two(n):
    if n==100:
        return 0
    elif n>200:
        return -1
    else:
        two(n+1)


def my_function():
    for _ in range(5):
        one()
        two(0)


def main():
    # 创建一个命名空间,并将需要运行的代码放入其中
    namespace = {'my_function': my_function}
    code_to_run = 'my_function()'

    # 使用runctx方法在指定上下文中运行代码并进行性能分析
    profile.runctx(code_to_run, namespace, namespace)


if __name__ == "__main__":
    main()
Cprofile 常用方法简介与案例
enable() and disable()
- 启用性能分析,在代码中调用该方法后,程序的执行将被性能分析器跟踪。
- 禁用性能分析,停止性能分析器的跟踪。
import cProfile

def one():
    a = [1,2,3,4]
    for _ in range(10):
        b = set(a)
        a += a
    S = 0
    for _ in range(100):
        S += sum(b)

def two(n):
    if n==100:
        return 0
    elif n>200:
        return -1
    else:
        two(n+1)

def main():

    profiler = cProfile.Profile()
    profiler.enable()

    for _ in range(5):
        one()
        two(0)

    profiler.disable()

    profiler.print_stats()

if __name__ == "__main__":
    main()
1011 function calls (511 primitive calls) in 0.000 seconds
Ordered by: standard name
ncalls tottime percall cumtime percall filename:lineno(function)
505/5 0.000 0.000 0.000 0.000 0.py:12(two)
5 0.000 0.000 0.000 0.000 0.py:3(one)
500 0.000 0.000 0.000 0.000 {built-in method builtins.sum}
1 0.000 0.000 0.000 0.000 {method 'disable' of '_lsprof.Profiler' objects}
getstats()
- 返回一个包含性能分析结果的Stats对象,可以对其进行更详细的处理和分析。
| Data descriptors defined here:
|
| callcount
| how many times this was called
|
| calls
| details of the calls
|
| code
| code object or built-in function name
|
| inlinetime
| inline time in this entry (not in subcalls)
|
| reccallcount
| how many times called recursively
|
| totaltime
| total time in this entry
|
| ----------------------------------------------------------------------
import cProfile

def one():
    a = [1,2,3,4]
    for _ in range(10):
        b = set(a)
        a += a
    S = 0
    for _ in range(100):
        S += sum(b)

def two(n):
    if n==100:
        return 0
    elif n>200:
        return -1
    else:
        two(n+1)

def main():

    profiler = cProfile.Profile()
    profiler.enable()

    for _ in range(5):
        one()
        two(0)

    profiler.disable()

    stats = profiler.getstats()
    print("Execution time of first function call:")
    print(stats[0].totaltime)
    #print(help(stats[0]))
    for i in range(1,len(stats)):
        print(stats[i].totaltime)

if __name__ == "__main__":
    main()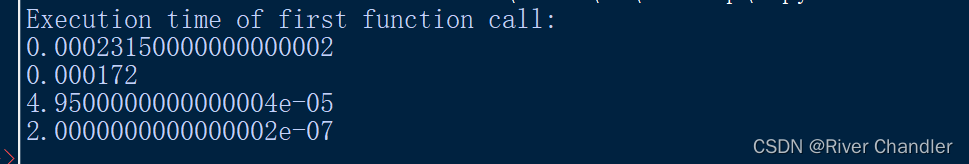
dump_stats(filename) 与 pstats
- 将性能分析结果保存到指定的文件中
import cProfile
import pstats

def one():
    a = [1,2,3,4]
    for _ in range(10):
        b = set(a)
        a += a
    S = 0
    for _ in range(100):
        S += sum(b)

def two(n):
    if n==100:
        return 0
    elif n>200:
        return -1
    else:
        two(n+1)


def my_function():
    for _ in range(5):
        one()
        two(0)


def main():
    profiler = cProfile.Profile()
    profiler.enable()

    my_function()

    profiler.disable()

    profiler.dump_stats("profile_stats.prof")


def read_prof_file(filename):
    stats = pstats.Stats(filename)
    stats.print_stats()

if __name__ == "__main__":
    main()
    read_prof_file("profile_stats.prof")


 3476
3476


 被折叠的 条评论
为什么被折叠?
被折叠的 条评论
为什么被折叠?
 到【灌水乐园】发言


