


 文章介绍了matplotlib库中pcolormesh函数的使用,特别是shading参数对网格着色的影响。通过示例展示了flat、nearest和gouraud三种着色方式,以及如何结合numpy生成和可视化二维数据矩阵Z。
pcolormesh 的官方文档:https://matplotlib.org/stable/api/_as_gen/matplotlib.pyplot.pcolormesh.html
pcolormesh 着色规则的官方文档:https://matplotlib.org/stable/gallery/images_contours_and_fields/pcolormesh_grids.html
matplotlib.axes.Axes.pcolormesh 函数和 matplotlib.axes.Axes.pcolor 函数均有 shading 参数可以用于网格的布局和网格点之间的着色。如果令 Z 表示颜色,X 和 Y 表示网格,那么如果 Z 的形状为
m
×
n
m \times n
m×n,则 X 和 Y 的 shape 可以是
(
m
+
1
)
×
(
n
+
1
)
(m+1)\times(n+1)
(m+1)×(n+1) 或
m
×
n
m \times n
m×n,具体取决于 shading 参数的选择。
>>> from matplotlib import pyplot as plt
... import numpy as np
... np.random.seed(0)
构造测试数据如下:
>>> n_rows = 3
... n_cols = 5
... x = np.arange(n_cols + 1)
... y = np.arange(n_rows + 1)
... Z = np.random.randint(0, 3, (n_rows, n_cols))
>>> Z
[[0 1 0 1 1]
 [2 0 2 0 0]
 [0 2 1 2 2]]
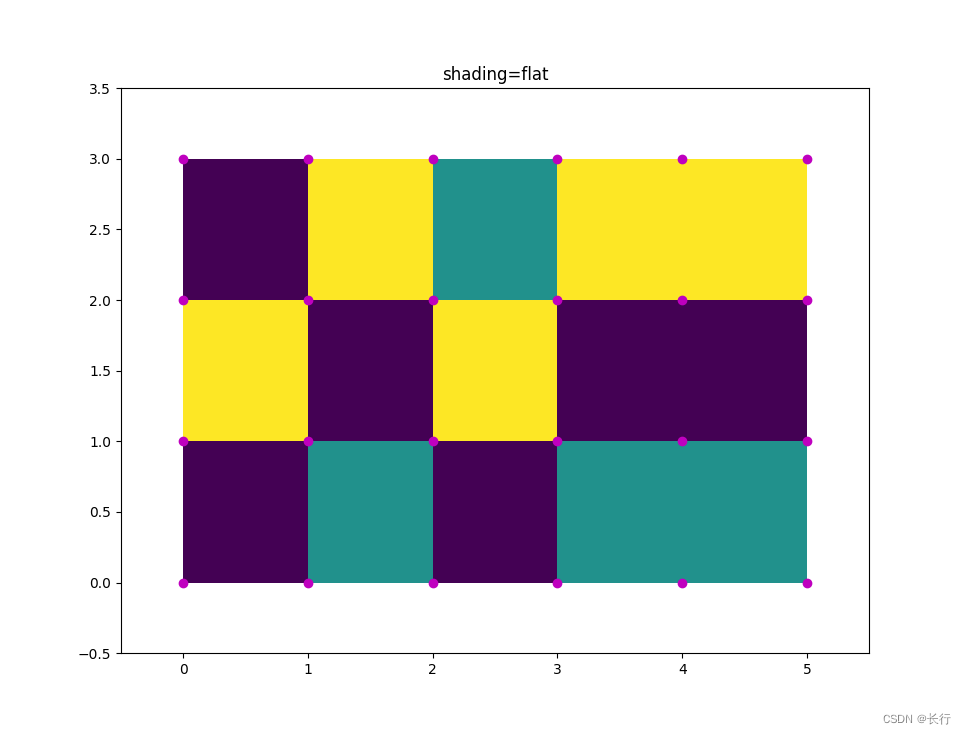
shading = Flat
>>> fig, ax = plt.subplots()
... ax.pcolormesh(x, y, Z, shading="flat", vmin=np.min(Z), vmax=np.max(Z))
... X, Y = np.meshgrid(x, y)
... ax.plot(X.flat, Y.flat, "o", color="m")
... ax.set_xlim(-0.5, 5.5)
... ax.set_ylim(-0.5, 3.5)
... ax.set_title("shading=flat")
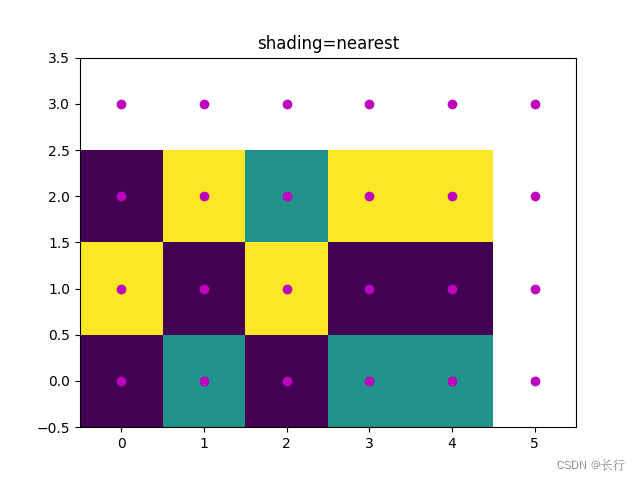
shading = nearest
>>> fig, ax = plt.subplots()
... ax.pcolormesh(x[:-1], y[:-1], Z, shading="nearest", vmin=np.min(Z), vmax=np.max(Z))
... X, Y = np.meshgrid(x, y)
... ax.plot(X.flat, Y.flat, "o", color="m")
... ax.set_xlim(-0.5, 5.5)
... ax.set_ylim(-0.5, 3.5)
... ax.set_title("shading=nearest")
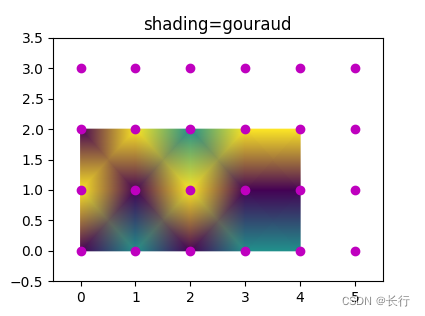
shading = gouraud
fig, ax = plt.subplots()
ax.pcolormesh(x[:-1], y[:-1], Z, shading="gouraud", vmin=np.min(Z), vmax=np.max(Z))
X, Y = np.meshgrid(x, y)
ax.plot(X.flat, Y.flat, "o", color="m")
ax.set_xlim(-0.5, 5.5)
ax.set_ylim(-0.5, 3.5)
ax.set_title("shading=gouraud")


 6708
6708

 被折叠的 条评论
为什么被折叠?
被折叠的 条评论
为什么被折叠?
 到【灌水乐园】发言


