


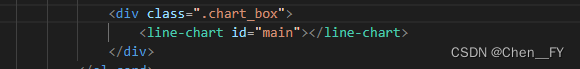
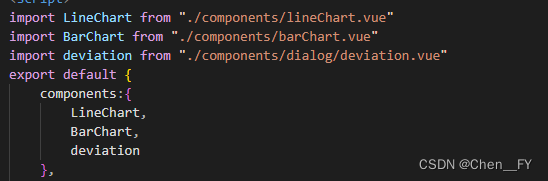
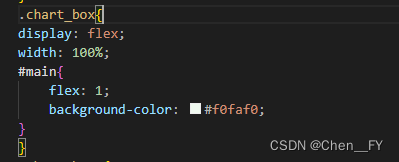
1.父组件:
2.子组件lineChart:

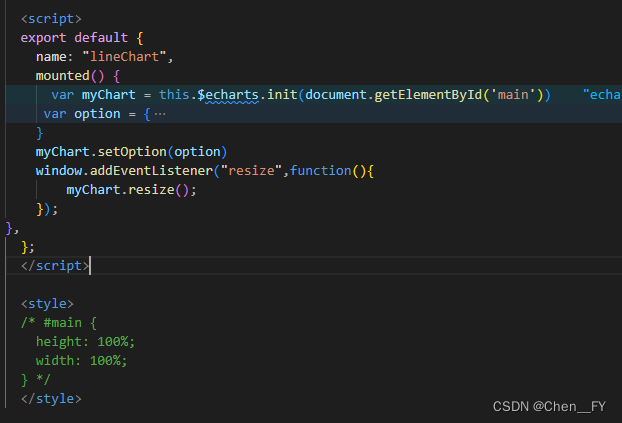
子组件的完整代码:
<template>
    <div style="height: 320px; width: 100% ;"></div>
  </template>

  <script>
  export default {
    name: "lineChart",
    mounted() {
      var myChart = this.$echarts.init(document.getElementById('main'))
     var option = {
        tooltip: {
            trigger: 'axis'
        },
        legend: {
            data: ['位移载荷', '电参', '压力表', '温度表'],
            textStyle: {
                fontSize: 14
            }
        },
        grid: {
            left: '3%',
            right: '4%',
            bottom: '3%',
            containLabel: true
        },
        xAxis: {
            type: 'category',
            boundaryGap: false,
            data: ['1月', '2月', '3月', '4月', '5月', '6月']
        },
        yAxis: {
            type: 'value'
        },
        series: [
            {
            name: '位移载荷',
            type: 'line',
            stack: 'Total',
            data: [120, 132, 101, 134, 90, 230, 210]
            },
            {
            name: '电参',
            type: 'line',
            stack: 'Total',
            data: [220, 182, 191, 234, 290, 330, 310]
            },
            {
            name: '压力表',
            type: 'line',
            stack: 'Total',
            data: [150, 232, 201, 154, 190, 330, 410]
            },
            {
            name: '温度表',
            type: 'line',
            stack: 'Total',
            data: [320, 332, 301, 334, 390, 330, 320]
            },
        ]
    }
    myChart.setOption(option)
    window.addEventListener("resize",function(){
        myChart.resize();
    });
},
  };
  </script>

  <style>
  /* #main {
    height: 100%;
    width: 100%;
  } */
  </style>
4.echarts自适应窗口大小:addEventListener可以使多个echarts图表自适应,且不会被覆盖。但使用onresize时,它只适合只有一个图表的时候使用,当使用多个图表时会被覆盖,就只有一个图表能自适应
 // 多个图表使用
window.addEventListener("resize",function(){
        myChart.resize();
    });
// 单个图表使用
 window.onresize("resize",function(){
        myChart.resize();
   });


 1640
1640


 被折叠的 条评论
为什么被折叠?
被折叠的 条评论
为什么被折叠?
 到【灌水乐园】发言


