


技术栈:Vue + ECharts.js
简介
某些情况,大屏页面需要实现一些比较美观的图表,常用的图表插件有echarts,此篇的实现效果为饼图半环形图和南丁格尔玫瑰图的结合体。
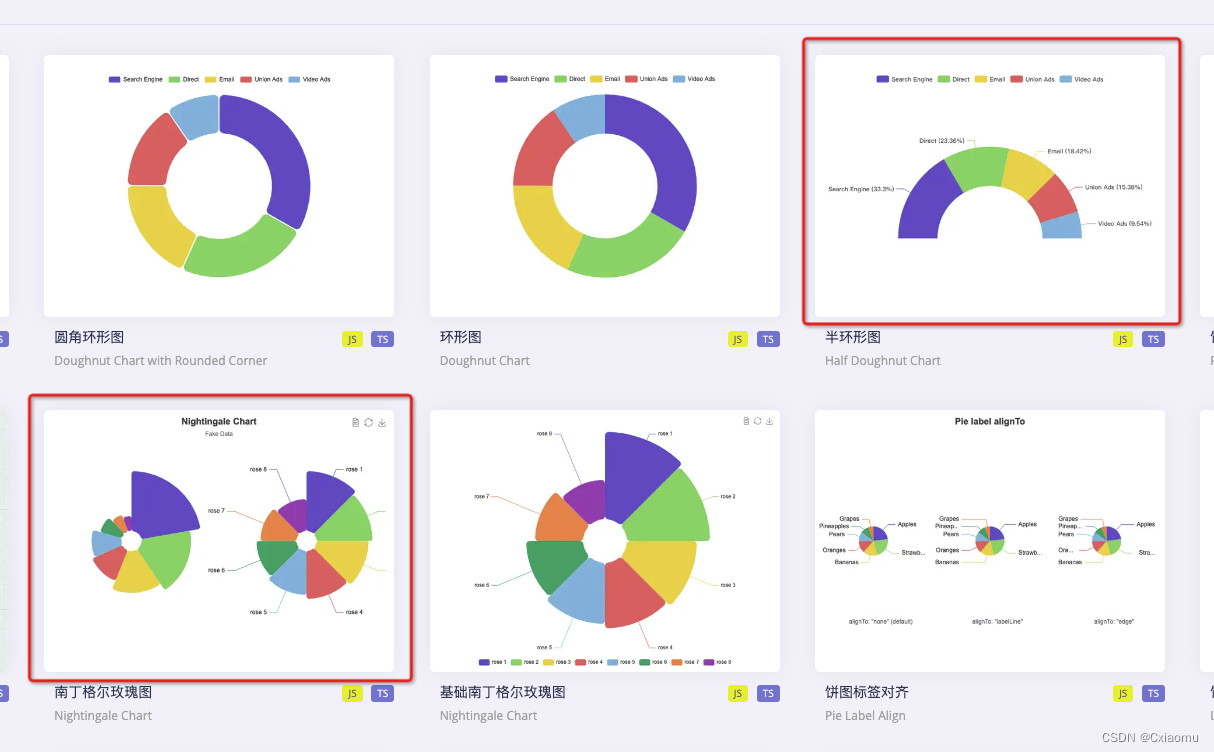
这两种图具体实例可查看echarts官网
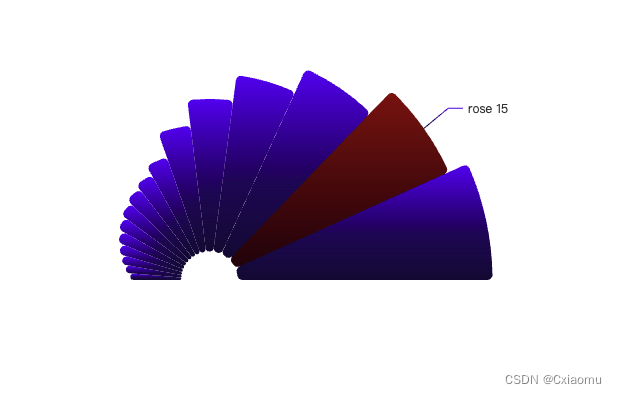
目标图:

echarts示例:
同时实现轮播高亮,采用定时循环操作,先调用echarts的downplay取消所有的高亮,再调用highlight高亮指定数据。
每次窗口大小改变时,进行监听,chart更新,调用resize方法,避免出现错乱效果。
实现
安装echarts插件
npm install echarts --save
页面布局
<template>
  <div>
    <div id="pieChart"></div>
  </div>
</template>
<style>
#pieChart {
  width: 500px;
  height: 250px;
  margin: 0 auto;
}
</style>
逻辑实现
resize
监听窗口resize事件,及时重绘图表。
其中,需要注意到keep-alive 缓存特殊的两个阶段,activated(组件激活时) 和deactivated(组件停用时) 。
- activated(组件激活时) keep-alive 缓存的组件激活时调用。
- deactivated(组件停用时) keep-alive 缓存的组件停用时调用。
添加keep-alive标签后会增加activated和deactivated这两个生命周期函数。
import { debounce } from '@/utils'

export default {
  data() {
    return {
      $_resizeHandler: null
    }
  },
  mounted() {
    this.initListener()
  },
  // 组件激活时
  activated() {
    if (!this.$_resizeHandler) {
      // avoid duplication init
      this.initListener()
    }

    // when keep-alive chart activated, auto resize
    this.resize()
  },

  beforeDestroy() {
    this.destroyListener()
  },

  // 组件停用时
  deactivated() {
    this.destroyListener()
  },
  methods: {

    // 初始化监听
    initListener() {
      this.$_resizeHandler = debounce(() => {
        this.resize()
      }, 100)
      window.addEventListener('resize', this.$_resizeHandler)
    },

    // 销毁监听
    destroyListener() {
      window.removeEventListener('resize', this.$_resizeHandler)
      this.$_resizeHandler = null
    },

    // 图表resize
    resize() {
      const { chart } = this
      chart && chart.resize()
    }
  }
}
常规debounce方法:
/**
 * @param {Function} func
 * @param {number} wait
 * @param {boolean} immediate
 * @return {*}
 */
export function debounce(func, wait, immediate) {
  let timeout, args, context, timestamp, result

  const later = function() {
    // 据上一次触发时间间隔
    const last = +new Date() - timestamp

    // 上次被包装函数被调用时间间隔 last 小于设定时间间隔 wait
    if (last < wait && last > 0) {
      timeout = setTimeout(later, wait - last)
    } else {
      timeout = null
      // 如果设定为immediate===true,因为开始边界已经调用过了此处无需调用
      if (!immediate) {
        result = func.apply(context, args)
        if (!timeout) context = args = null
      }
    }
  }

  return function(...args) {
    context = this
    timestamp = +new Date()
    const callNow = immediate && !timeout
    // 如果延时不存在,重新设定延时
    if (!timeout) timeout = setTimeout(later, wait)
    if (callNow) {
      result = func.apply(context, args)
      context = args = null
    }

    return result
  }
}
图表效果绘制
import * as echarts from "echarts";
export default {
  name: "PieChart",
  data() {
    return {
      theChart: null,
    };
  },
  mounted() {
    this.renderChart();
  },
  methods: {
    // 渲染图表
    renderChart() {
      if (this.theChart) return;
      this.theChart = echarts.init(document.getElementById("pieChart"));
      const options = {
        series: [
          {
            type: "pie",
            radius: ["5%", "100%"],
            startAngle: 180,
            endAngle: 360,
            center: ["50%", "60%"],
            roseType: "radius",
            itemStyle: {
              borderRadius: 5,
              color: {
                type: "linear",
                x: 0,
                y: 0,
                x2: 0,
                y2: 1,
                colorStops: [
                  {
                    offset: 0,
                    color: "#005DEF", // 0% 处的颜色
                  },
                  {
                    offset: 0.6,
                    color: "#03255c", // 60% 处的颜色
                  },
                  {
                    offset: 1,
                    color: "#021739", // 100% 处的颜色
                  },
                ],
                global: false, // 缺省为 false
              },
            },
            // 正常不显示label
            label: {
              show: false,
            },
            // 高亮时效果
            emphasis: {
              label: {
                show: true,
              },
              itemStyle: {
                color: {
                  type: "linear",
                  x: 0,
                  y: 0,
                  x2: 0,
                  y2: 1,
                  colorStops: [
                    {
                      offset: 0,
                      color: "#910302", // 0% 处的颜色
                    },
                    {
                      offset: 1,
                      color: "#290208", // 100% 处的颜色
                    },
                  ],
                  global: false, // 缺省为 false
                },
              },
            },
            data: [
              { value: 10, name: "rose 1" },
              { value: 11, name: "rose 2" },
              { value: 12, name: "rose 3" },
              { value: 13, name: "rose 4" },
              { value: 14, name: "rose 5" },
              { value: 15, name: "rose 6" },
              { value: 16, name: "rose 7" },
              { value: 17, name: "rose 8" },
              { value: 18, name: "rose 9" },
              { value: 20, name: "rose 10" },
              { value: 25, name: "rose 11" },
              { value: 30, name: "rose 12" },
              { value: 35, name: "rose 13" },
              { value: 40, name: "rose 14" },
              { value: 45, name: "rose 15" },
              { value: 50, name: "rose 16" },
            ],
          },
        ],
      };
      this.theChart.setOption(options);
      this.handleChartLoop(options, this.theChart);
    },

    // 循环高亮
    handleChartLoop(option, myChart) {
      if (!myChart) {
        return;
      }
      let currentIndex = -1; // 当前高亮图形在饼图数据中的下标
      if (this.changePieInterval) clearInterval(this.changePieInterval);
      this.changePieInterval = setInterval(selectPie, 1000); // 设置自动切换高亮图形的定时器

      // 取消所有高亮并高亮当前图形
      function highlightPie() {
        // 遍历饼图数据,取消所有图形的高亮效果
        for (var idx in option.series[0].data) {
          myChart.dispatchAction({
            type: "downplay",
            seriesIndex: 0,
            dataIndex: idx,
          });
        }
        // 高亮当前图形
        myChart.dispatchAction({
          type: "highlight",
          seriesIndex: 0,
          dataIndex: currentIndex,
        });
      }
      this.theChart.on("mouseover", (params) => {
        // 用户鼠标悬浮到某一图形时,停止自动切换并高亮鼠标悬浮的图形
        if (this.changePieInterval) clearInterval(this.changePieInterval);
        currentIndex = params.dataIndex;
        highlightPie();
      });

      this.theChart.on("mouseout", (params) => {
        // 用户鼠标移出时,重新开始自动切换
        if (this.changePieInterval) clearInterval(this.changePieInterval);
        this.changePieInterval = setInterval(selectPie, 2000);
      });
      // 高亮效果切换到下一个图形
      function selectPie() {
        var dataLen = option.series[0].data.length;
        currentIndex = (currentIndex + 1) % dataLen;
        highlightPie();
      }
    },
  },
};
效果
实现完成后的效果如图。
默认不显示数据的label,高亮时显示;鼠标悬停时,仅高亮当前数据;移开后,恢复自动轮播。


 266
266


 被折叠的 条评论
为什么被折叠?
被折叠的 条评论
为什么被折叠?
 到【灌水乐园】发言


