


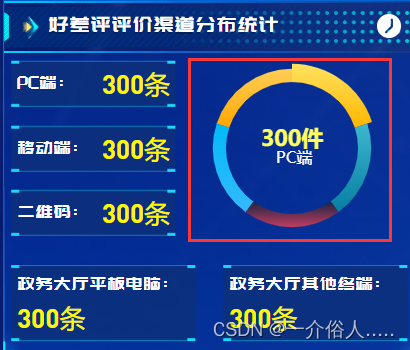
图例:
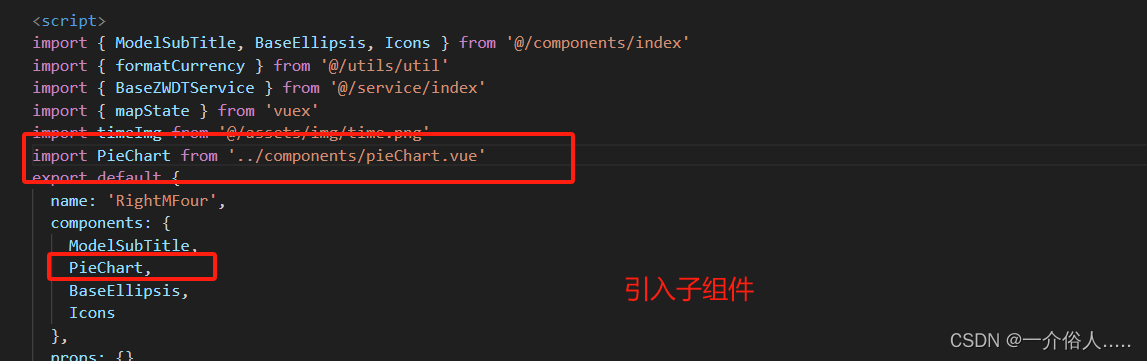
父组件所有代码:引入:子组件:
代码:
import PieChart from '../components/pieChart.vue'
PieChart,
div代码:
<PieChart:id="'pjqdPie'"
:autoPlay="true"
:pieData="pjqdList"
:pieCenter="['50%', '50%']"
:pieRadius="['75%', '90%']"
:seriesData="seriesData"
:options="autoPieOpt" />
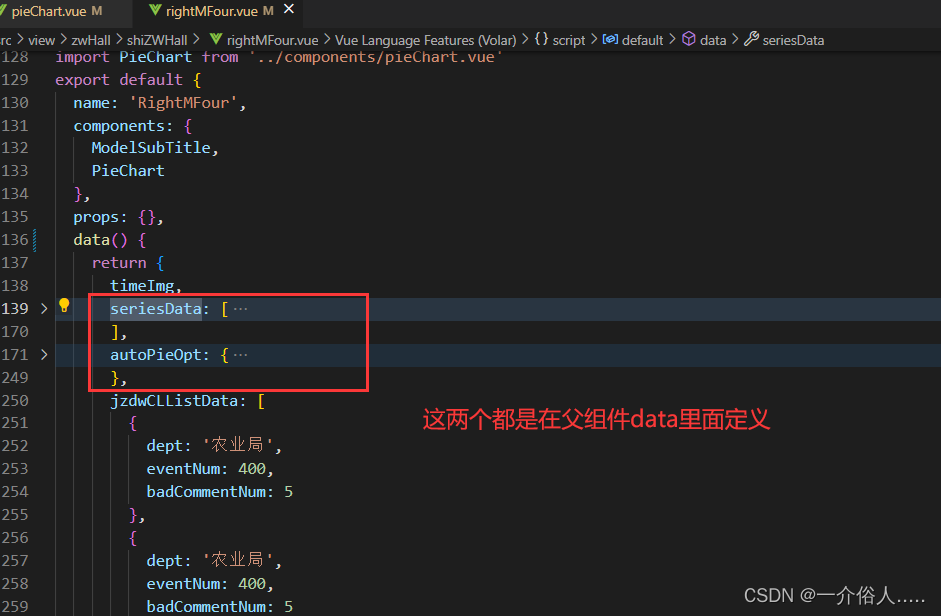
data:
data代码:seriesData: [ { label: { show: false, position: 'center' }, emphasis: { label: { show: true, formatter: (params) => { const str = `{a|${formatCurrency(params.value)}件}` + '\n' + `{b|${params.name}}` return str }, rich: { a: { color: '#ffff5d', fontSize: 35, fontWeight: 'bolder', lineHeight: 60, }, b: { color: '#fff', fontSize: 25 } } } }, labelLine: { show: false } } ], autoPieOpt: { tooltip: { show: false }, color: [ { type: 'linear', x: 0, y: 0, x2: 0, y2: 1, colorStops: [ { offset: 0, color: '#FFCE57' // 0% 处的颜色 }, { offset: 1, color: '#FFA700' // 100% 处的颜色 } ], global: false // 缺省为 false }, { type: 'linear', x: 0, y: 0, x2: 0, y2: 1, colorStops: [ { offset: 0, color: '#3DB7CE' // 0% 处的颜色 }, { offset: 1, color: '#067EA2' // 100% 处的颜色 } ], global: false // 缺省为 false }, { type: 'linear', x: 0, y: 0, x2: 0, y2: 1, colorStops: [ { offset: 0, color: '#1A2444' // 0% 处的颜色 }, { offset: 1, color: '#C03D5F' // 100% 处的颜色 } ], global: false // 缺省为 false }, { type: 'linear', x: 0, y: 0, x2: 0, y2: 1, colorStops: [ { offset: 0, color: '#fff' // 0% 处的颜色 }, { offset: 1, color: '#35B9FD' // 100% 处的颜色 } ], global: false // 缺省为 false } ] },
子组件所有代码:<template> <div class="WH pieBox"> <div class="WH" :id="id"></div> <span class="chartName">{{ pieName }}</span> </div> </template> <script> export default { name: 'PieChart', components: {}, props: { id: { type: String, require: true, default: '' }, pieName: { type: String, require: false, default: '' }, pieRadius: { type: Array, require: false, default: () => ['30%', '70%'] }, pieCenter: { type: Array, require: false, default: () => ['50%', '50%'] }, pieData: { type: Array, require: false, default: () => [ { value: 1048, name: '规自' }, { value: 735, name: '保密' }, { value: 580, name: '台办' } ] }, options: { type: Object, require: false, default: () => {} }, autoPlay: { type: Boolean, require: false, default: false }, seriesData: { type: Array, require: false, default: () => [] } }, data() { return { pieChart: null, timer: null } }, watch: { pieData: { handler() { this.initChart(this.options) }, deep: true }, options: { handler() { this.initChart(this.options) }, deep: true }, seriesData: { handler() { this.initChart(this.options) }, deep: true } }, computed: {}, mounted() { this.pieChart = this.$echarts.init(document.getElementById(this.id)) this.$nextTick(() => { this.initChart(this.options) }) }, beforeDestroy() { clearInterval(this.timer) this.timer = null }, methods: { initChart(opt) { this.pieChart && this.pieChart.clear() if (this.autoPlay) { let ind = 0 if (this.timer) { clearInterval(this.timer) } this.timer = setInterval(() => { this.pieChart.dispatchAction({ type: 'downplay', seriesIndex: 0, dataIndex: ind }) ind = (ind + 1) % this.pieData.length this.pieChart.dispatchAction({ type: 'highlight', seriesIndex: 0, dataIndex: ind }) }, 3000) this.pieChart.on('mouseover', (params) => { clearInterval(this.timer) this.pieChart.dispatchAction({ type: 'downplay', seriesIndex: 0, dataIndex: ind }) this.pieChart.dispatchAction({ type: 'highlight', seriesIndex: 0, dataIndex: params.dataIndex }) ind = params.dataIndex }) this.pieChart.on('mouseout', (params) => { ind = params.dataIndex if (this.timer) { clearInterval(this.timer) } this.timer = setInterval(() => { this.pieChart.dispatchAction({ type: 'downplay', seriesIndex: 0, dataIndex: ind }) ind = (ind + 1) % this.pieData.length this.pieChart.dispatchAction({ type: 'highlight', seriesIndex: 0, dataIndex: ind }) }, 3000) }) } const opts = { tooltip: { trigger: 'item' } } const series = [ { name: this.pieName, type: 'pie', radius: this.pieRadius, center: this.pieCenter, avoidLabelOverlap: false, selectedMode: false, label: { show: false, position: 'center', color: '#fff', fontSize: 14 }, emphasis: { label: { show: true, position: 'inside', color: '#fff', fontSize: 14 } }, labelLine: { show: true }, data: [...this.pieData] } ] this.seriesData.length > 0 && this.seriesData.forEach((item, ind) => { series[ind] = Object.assign(series[ind], item) }) Object.assign(opts, { series: series }) Object.assign(opts, opt) this.pieChart.setOption({ ...opts }, true) // 视口大小变化 charts图表自适应 window.addEventListener('resize', () => { this.pieChart && this.pieChart.resize() }) } } } </script> <style lang="less" scoped> .pieBox { position: relative; .chartName { width: 100%; text-align: center; color: #fff; position: absolute; bottom: 8px; } } </style>看这个文件:


07-09
 2536
2536
2536
04-22
2515
2515
02-01
7612
7612
09-13
“相关推荐”对你有帮助么?
-

 非常没帮助
非常没帮助 -

 没帮助
没帮助 -

 一般
一般 -

 有帮助
有帮助 -

 非常有帮助
非常有帮助
提交

 被折叠的 条评论
为什么被折叠?
被折叠的 条评论
为什么被折叠?
 到【灌水乐园】发言


