


一、前期需要准备的数据
1.中国地图的geojson格式的数据,可以在DataV.GeoAtlas地理小工具系列这里下载,各省份、县的也可以拿到
2.国际地图的geojson格式的数据数据(可以自己在github上找)
3.如果之前没有用过renderjs,可以先看看在这个插件renderjs-echarts-demo - DCloud 插件市场的代码,然后试试将地图展示出来
4.echarts的版本为4.2.1,可以在这里下载ECharts 在线构建(图表只选择map,然后坐标系和组件由自己的功能而定,选择好后直接下载,就会生成一个echarts.js,开发环境下可以先不压缩方便查看问题),其他的版本可能会有问题,但是可以自己试试。
二、开始
1.组件文件
A、因为echartsjs比较大,所以推荐动态引入,但是我这里仅仅是为了演示demo,就直接引的哈(官方原话:不要直接引用大型类库,推荐通过动态创建 script 方式引用)
B、因为renderJs和普通script是不能互相直接通信的,所以在renderJs是不能直接拿到组件的传值以及组件相关的方法的,但是我们可以通过change监听属性,在renderJs中获取到组件的传值,并且也可以通过this.$ownerInstance.callMethod() 调用逻辑层vue选项式中的 methods 中定义的方法。官方文档renderjs | uni-app官网
C、地图的点击事件,因为uniapp 环境会注入 wx 全局变量,导致zrender 判断认为微信环境,从而引起echarts 功能异常。所以点击事件通过renderjs传递到外部,见onClick事件
<template>
	<view>
		<view
			class="echarts"
			:id="mapid"
			:datas="datas"
			:mapName="mapName"
			:mapJson="mapJson"
			:change:id="echarts.getMapId"
			:change:mapName="echarts.getMapName"
			:change:datas="echarts.getDatas"
			:change:mapJson="echarts.getMapJson"
			@click="echarts.onClick">
		</view>
	</view>
</template>

<script>
	export default {
		name: 'Echarts',
		props: {
			/**
			 * @description geojson下的features
			 */
			datas:{
			   type:Array,
			   default:(()=>{
					return []
			   })
			},
			chartType:{
				type:String,
				default:'map'
			},
			mapName:{
				type:String,
				default:'china'
			},
			/**
			 * @description 地图的geojson数据
			 */
			mapJson:{
				type:Object,
				default(){
					return {}
				}
			},
			mapid:{
				type:String,
				default:'chinaMap'
			},
		},
		created() {
		},
		methods: {
			/**
			 * renderjs内的点击事件,回调到父组件
			 * @param {Object} params
			 */
			onViewClick(params) {
				console.error("要回调到父组件的",params)
				this.$emit('click', params)
			},
		}
	}
</script>

<script module="echarts" lang="renderjs">
	import echarts from './echarts.min.js';
	// import echarts from './echarts421.js';
	export default {
		data() {
			return {
				option:{
					title: {
						text: 'map',
						left:'center',
						top:'10',
						show:false,
						textStyle:{
							 fontSize:'13',
							 color:'#666',
						}
					},
					series:[
						{
							name: 'china',
							type: 'map',
							zoom:1.25,
							mapType:'china', // 自定义扩展图表类型
							// // 设置地图上的文字展示
							label: {
								fontSize:'10',
								color: '#fff'
							},
							itemStyle:{
								emphasis: {
									label:{
										show: true,
										// color:'#fff'//设置hover时字体的颜色
									},
									areaColor: "#2B79FF",
								}
							},
							select:{
								itemStyle:{
									color:'#fff',
									areaColor:'#2B79FF',
								}
							},
							data:[],
						}
					]
				},
				chart: null,
				clickData: null, // echarts点击事件的值
				mapNameA:'',
				datasA:[],
				mapJsonA:null,
				id:''
			}
		},
		mounted() {
			// if (typeof window.echarts === 'object') {
			// 	this.init()
			// } else {
			// 	// 动态引入类库
			// 	const script = document.createElement('script')
			// 	script.src = '/static/echartsJs/echarts.min.js'
			// 	script.onload = this.init
			// 	document.head.appendChild(script)
			// 	console.error(echarts)
			// }
			setTimeout(()=> {
				this.init()
			}, 300);
		},
		methods: {
			/**
			 * 由于renderjs与普通script是无法直接沟通的,所以要获取传参的值就需要change来监听
			 */
			getMapId(val){
				console.error("MapId",val)
				this.id=val
			},
			getMapName(val){
				console.error("mapName",val)
				this.mapNameA=val
			},
			getMapJson(val){
				console.error("MapJson",val)
				this.mapJsonA=val
			},
			getDatas(val){
				this.datasA=val
				console.error("Datas",val)
				setTimeout(()=> {
					this.init()
				}, 10);
			},
			/**
			 * 初始化echarts
			 */
			init() {
				console.error("init")
				echarts.registerMap(this.mapNameA,this.mapJsonA);
				// 根据id初始化图表
				this.chart = echarts.init(document.getElementById(this.id))
				this.option.series[0].mapType=this.mapNameA
				this.option.series[0].name=this.mapNameA
				this.option.series[0].data=this.datasA
				this.update()
				// echarts的点击事件
				this.chart.on('click', params => {
					console.error("param",params)
					// 把点击事件的数据缓存下来
					this.clickData = params
				})
			},
			/**
			 * 点击事件,可传递到外部
			 * @param {Object} event
			 * @param {Object} instance
			 */
			onClick(event, instance) {
				if (this.clickData) {
					// 把echarts点击事件相关的值传递到renderjs外
					instance.callMethod('onViewClick', {
						value: this.clickData.data.properties,
						name: this.clickData.name,
						seriesName: this.clickData.seriesName
					})
					// 重置上次点击数据
					this.clickData = null
				}
			},
			/**
			 * 监测数据更新
			 * @param {Object} option
			 */
			update() {
				if (this.chart) {
					// 如果有其他功能也可以在此处进行操作
					// 设置新的option
					this.chart.setOption(this.option)
				}
			},
		}
	}
</script>

<style lang="scss" scoped>
	.echarts {
		width: 100%;
		height: 100%;
	}
</style>
2.父页面如何引用
A、echartsClick就是地图点击事件的接收function
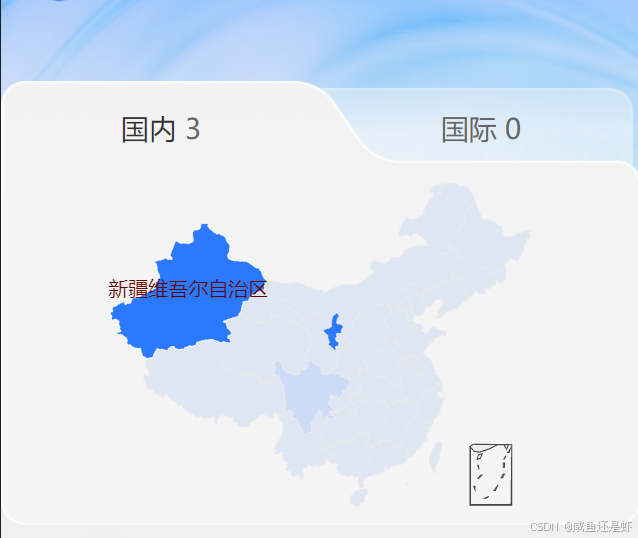
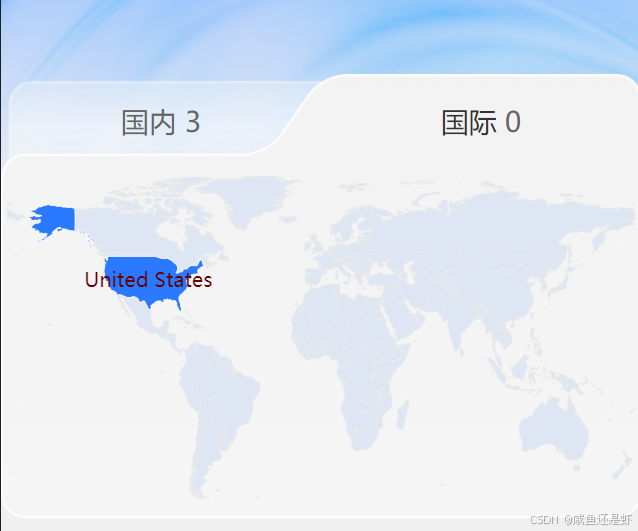
B、中国地图如果想把南海诸岛已小框的形式展示在旁,mapName值必须得是‘china’,否则显示不出来
C、如果想要去掉大地图上南海诸岛的展示可以将geojson上的部分数据删掉,详细操作见vue echarts 中国地图处理南海诸岛为简图_echarts地图海南诸岛多余部分-CSDN博客
<echarts chartType="map" :datas="datas" :mapName='mapName' mapid="chinaMap" :mapJson="typejson" @click="echartsClick"></echarts>3.至于地图下钻,点击事件能拿到点击的省份地区,那直接请求相应的geojson数据,然后重新渲染echarts就行,具体逻辑自定。
至此结束,以下是效果图


 4499
4499

 被折叠的 条评论
为什么被折叠?
被折叠的 条评论
为什么被折叠?
 到【灌水乐园】发言


