


Pandas常用数据类型
1.Series 一维,带便签的数组
2.DataFrame 二维,Series容器
创建Series对象
# pandas的常用数据类型:
# 1.Series 一维,带便签的数组
# 2.DataFrame 二维,Series容器
import pandas as pd
import numpy as np
import string
# 创建一个Series对象
t = pd.Series(np.arange(10), index=list(string.ascii_uppercase[:10]))
print(t)
print(type(t))
print("*"*100)
# 字典创建的方式
a = {string.ascii_uppercase[i]: i for i in range(10)} # 字典推导式创建一个字典a
# print(a)
b = pd.Series(a) # 通过字典创建一个Series,索引即为字典的键
print(b)
print("*"*100)
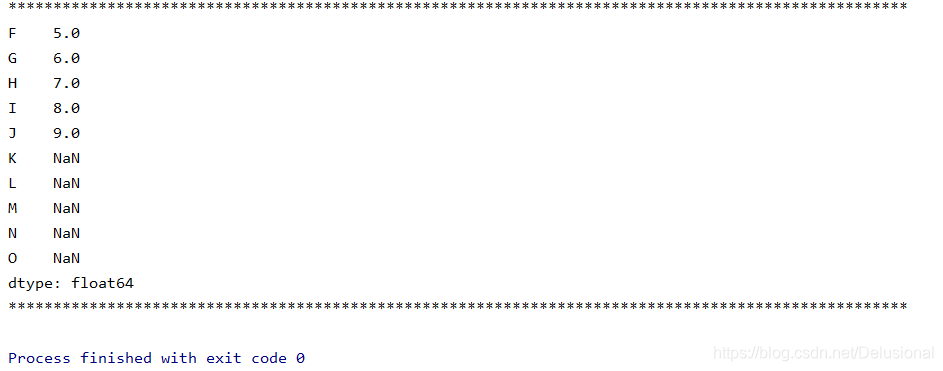
# 当键和值对应不上时,那么就取nan,例如下面的例子,值的数量比键的要少
c = pd.Series(a, index=list(string.ascii_uppercase[5: 15]))
print(c)
print("*"*100)

切片和索引
# 只取值
print(b[1])
print(type(b[1]))
print("*"*100)

# 取一行,包含索引和值
print(b[[1]])
print(type(b[[1]]))
print("*"*100)

# 当取多行时,需要在额外添加一个[]
print(b[[2, 3, 6]])
print("*"*100)

# 取值的大于4的行
print(b[b > 4])
print("*"*100)

# 按索引取值
print(b[["A", "F", "G"]])
print("*"*100)

# index和values方法,取所有的索引和值
print(b.index)
print(b.values)
print("*"*100)

# Series对象本质上由两个数组构成,一个构成对象的键,一个数组构成对象的值,键->值
print(type(b.index))
print(type(b.values))
print("*"*100)

# Series也有where方法,但是和numpy中的不同
print(b.where(b > 1, 10))   # 这里时将小于等于1的替换为10,跟之前不同

读取csv文件
import pandas as pd

# 读取csv文件
df = pd.read_csv("./dogNames2.csv")

print(df[(800 < df["Count_AnimalName"]) | (df["Count_AnimalName"] < 1000)])
DataFrame
import pandas as pd
import numpy as np
import string

# DataFrame对象既有行索引,又有列索引
# 行索引,表明不同行,横向索引,叫index,0轴,axis=0
# 列索引,表名不同列,纵向索引,叫columns,1轴,axis=1
t = pd.DataFrame(np.arange(12).reshape(3, 4))
# print(t)

# 指定索引,index指定行索引,columns指定列索引
t = pd.DataFrame(np.arange(12).reshape(3, 4), index=list(string.ascii_uppercase[:3])
                 , columns=list(string.ascii_uppercase[-4:]))
# print(t)

# 基本方法
# print(t.shape)          # 行数 列数
# print(t.dtypes)         # 列数据类型
# print(t.ndim)           # 数据维度
# print(t.index)          # 行索引
# print(t.columns)        # 列索引
# print(t.values)         # 对象值,二维ndarray数组

# 整体情况查询
# print(t.head(3))        # 显示头部几行,默认为5行
# print(t.tail(3))        # 显示末尾几行,默认为5行
# print(t.info())         # 信息概览
# print(t.describe())     # 快速统计结果

# 案例:使用次数最高的前几个名字
df = pd.read_csv("./dogNames2.csv")
# print(df.head())
# print(df.info())

# DataFrame中排序的方法
df = df.sort_values(by="Count_AnimalName", ascending=False)      # ascending=True从小到大,false为从大到小
print(df.head())
print("*"*100)

# pandas取行或者列的注意点
# - 方括号写数组,表示取行,对行进行操作
# - 写字符串(列的名称),表示取列,对列进行操作,取值后变成了Series类型
print(df[:5])
print("*"*100)

print(df["Row_Labels"])
print("*"*100)

print(type(df["Row_Labels"]))   # <class 'pandas.core.series.Series'>
print("*"*100)

loc和iloc方法
import pandas as pd
import numpy as np
import string

t = pd.DataFrame(np.arange(12).reshape(3, 4), index=list(string.ascii_uppercase[:3])
                 , columns=list(string.ascii_uppercase[-4:]))
# print(t)

# loc   通过标签索引行数据
# print(t.loc["A", "W"])      # 0
#
# print(t.loc["A", ["W", "Z"]])
# print(type(t.loc["A", ["W", "Z"]]))     # <class 'pandas.core.series.Series'>
#
# print(t.loc[["A", "C"], ["W", "Z"]])
#
# print(t.loc["A":, ["W", "Z"]])
#
# print(t.loc["A": "C", ["W", "Z"]])

# iloc 通过位置获取行数据
print(t.iloc[1: 3, [2, 3]])
print(t.iloc[1: 3, 1: 3])

# 赋值进行更改
t.loc["A", "Y"] = 100
print(t)
t.iloc[1: 2, 0: 2] = 200
print(t)

# 布尔索引
# 1. 回到之前狗的名字的问题上,假如我们想找到所有的使用次数超过800的狗的名字,应该怎么选择?
# df[df["Count_AnimalName"]>800]
# 2.找到所有的使用次数超过700并且名字的字符串的长度大于4的狗的名字
# df[(df["Row_labels"].str.len()>4)&(df["Count_AnimalName"]>700)]

缺失数据的处理
# 我们的数据缺失通常有两种情况:
# 一种就是空,None等,在pandas是NaN(和np.nan一样)
# 另一种是我们让其为0
# ---------------------------------------------------------
# 处理方式:
# 对于NaN的数据,在numpy中我们是如何处理的?
# 在pandas中我们处理起来非常容易
#
# 判断数据是否为NaN:pd.isnull(df),pd.notnull(df)
#
# 处理方式1:删除NaN所在的行列dropna (axis=0, how='any', inplace=False)
# 处理方式2:填充数据,t.fillna(t.mean()),t.fiallna(t.median()),t.fillna(0)
#
#
# 处理为0的数据:t[t==0]=np.nan
# 当然并不是每次为0的数据都需要处理
# 计算平均值等情况,nan是不参与计算的,但是0会
数据合并join和merge
# join:默认情况下他是把行索引相同的数据合并到一起
# merge:按照指定的列把数据按照一定的方式合并到一起,很像数据库的多表查询
import pandas as pd
import numpy as np

# 1.join方法
t1 = pd.DataFrame(np.ones((3, 4)), index=["A", "B", "C"])
print(t1)
# t1值如下
#      0    1    2    3
# A  1.0  1.0  1.0  1.0
# B  1.0  1.0  1.0  1.0
# C  1.0  1.0  1.0  1.0

t2 = pd.DataFrame(np.zeros((2, 5)), index=list("AB"), columns=list("YWXYZ"))
print(t2)
# t2值如下
#      Y    W    X    Y    Z
# A  0.0  0.0  0.0  0.0  0.0
# B  0.0  0.0  0.0  0.0  0.0

# 此时的t1和t2存在相同的行,那么两者可以使用join方法
print(t1.join(t2))
#      0    1    2    3    Y    W    X    Y    Z
# A  1.0  1.0  1.0  1.0  0.0  0.0  0.0  0.0  0.0
# B  1.0  1.0  1.0  1.0  0.0  0.0  0.0  0.0  0.0
# C  1.0  1.0  1.0  1.0  NaN  NaN  NaN  NaN  NaN

print(t2.join(t1))
#      Y    W    X    Y    Z    0    1    2    3
# A  0.0  0.0  0.0  0.0  0.0  1.0  1.0  1.0  1.0
# B  0.0  0.0  0.0  0.0  0.0  1.0  1.0  1.0  1.0

print("*"*100)
# 2.merge方法
t1 = pd.DataFrame(np.ones((3, 4)), index=list("ABC"), columns=list("MNOP"))
t1.iloc[0, 2] = "a"
t1.iloc[1, 2] = "b"
t1.iloc[2, 2] = "c"
print(t1)
#      M    N  O    P
# A  1.0  1.0  a  1.0
# B  1.0  1.0  b  1.0
# C  1.0  1.0  c  1.0

t2 = pd.DataFrame(np.zeros((2, 5)), index=list("AB"), columns=list("VWXYZ"))
t2.iloc[0, 2] = "c"
t2.iloc[1, 2] = "d"
print(t2)
#      V    W  X    Y    Z
# A  0.0  0.0  c  0.0  0.0
# B  0.0  0.0  d  0.0  0.0

# 默认的合并方式inner,交集,当列有相同时,指定on就可以,不需要left_on和right_on
print(t1.merge(t2, left_on="O", right_on="X"))
print(t1.merge(t2, left_on="O", right_on="X", how="inner"))

# merge outer,并集,NaN补全
print(t1.merge(t2, left_on="O", right_on="X", how="outer"))

# merge left,左边为准,NaN补全
print(t1.merge(t2, left_on="O", right_on="X", how="left"))

# merge right,右边为准,NaN补全
print(t1.merge(t2, left_on="O", right_on="X", how="right"))
单个条件分组
# 现在我们有一组关于全球星巴克店铺的统计数据,
# 1.美国的星巴克数量和中国的哪个多
# 2.中国每个省份星巴克的数量的情况

import pandas as pd
import numpy as np

file_path = './starbucks_store_worldwide.csv'
df = pd.read_csv(file_path)
# print(df.head(1))
# print(df.info())

# 分组操作
grouped = df.groupby(by="Country")
# print(grouped)

# 遍历
# for i, j in grouped:
#     print(i)  # i表示每一个country
#     print("-" * 100)
#     print(j, type(j))  # j是每个country下对应的信息,类型是DataFrame类型
#     print("*" * 100)

# 调用聚合方法
country_count = grouped['Brand'].count()
print(country_count)
print(country_count["US"])
print(country_count["CN"])

# 2.统计每个省份店铺的数量
china_data = df[df["Country"] == "CN"]

# 下面两者是一样的结果
grouped = china_data.groupby(by="State/Province")['Brand'].count()
grouped_temp = china_data.groupby(by="State/Province").count()['Brand']
print(grouped)
print(grouped_temp)
print(type(grouped))        # Series
print(type(grouped_temp))   # Series
print("*" * 1000)

# 以上是单个条件进行分组

# 数据按照多个条件进行分组,返回Series
# print(df.groupby(by=[df["Country"], df["State/Province"]]).count()['Brand'])
grouped = df["Brand"].groupby(by=[df["Country"], df["State/Province"]]).count()
print(grouped)
print(type(grouped))  # <class 'pandas.core.series.Series'>

# 数据按照多个条件进行分组,返回DataFrame
grouped1 = df[["Brand"]].groupby(by=[df["Country"], df["State/Province"]]).count()
# print(df["Brand"])      # 这个是series
# print(df[["Brand"]])    # 这个是Dataframe
print(grouped1)
print(grouped1.index)       # [('AD',  '7'),
                            # ('AE', 'AJ'),
                            # ('AE', 'AZ'),
                            # ('AE', 'DU'),]
grouped2 = df.groupby(by=[df["Country"], df["State/Province"]])[["Brand"]].count()
grouped3 = df.groupby(by=[df["Country"], df["State/Province"]]).count()[["Brand"]]

print("-"*100)
print(grouped2)
print(grouped3)
多个条件分组
import pandas as pd
import numpy as np

file_path = './starbucks_store_worldwide.csv'
df = pd.read_csv(file_path)

# 1.数据按照多个条件进行分组,返回Series
# print(df.groupby(by=[df["Country"], df["State/Province"]]).count()['Brand'])

# 下面三种书写形式返回的结果是一样的
grouped = df["Brand"].groupby(by=[df["Country"], df["State/Province"]]).count()
grouped_temp = df.groupby(by=[df["Country"], df["State/Province"]]).count()['Brand']
grouped_temp_2 = df.groupby(by=[df["Country"], df["State/Province"]])['Brand'].count()

print(grouped)
print(type(grouped))  # <class 'pandas.core.series.Series'>

print(grouped_temp)
print(type(grouped_temp))

print(grouped_temp_2)
print(type(grouped_temp_2))

print("="*200)
# -------------------------------------------------------------------------------------------------------------------------
# 2.数据按照多个条件进行分组,返回DataFrame,其中以两个查询条件为index,调用grouped1.index,结果是:
# [('AD',  '7'),
# ('AE', 'AJ'),
# ('AE', 'AZ'),
# ('AE', 'DU'),]

grouped1 = df[["Brand"]].groupby(by=[df["Country"], df["State/Province"]]).count()
grouped2 = df.groupby(by=[df["Country"], df["State/Province"]])[["Brand"]].count()
grouped3 = df.groupby(by=[df["Country"], df["State/Province"]]).count()[["Brand"]]
print(grouped1)
print(type(grouped1))
print(grouped2)
print(type(grouped2))
print(grouped3)
print(type(grouped3))

# 总结一下
# print(df["Brand"])      # 这个是series
# print(df[["Brand"]])    # 这个是Dataframe
索引和复合索引
import pandas as pd
import numpy as np

df = pd.DataFrame(np.ones((3, 4)), index=list("ABC"), columns=list("abcd"))
print(df)

# 获取index
print(df.index)     # Index(['A', 'B', 'C'], dtype='object')

# 指定index
df.index = ['X', 'Y', 'Z']
print(df)

# 重新设置index,注意这里不改变原来的Dataframe,要是索引跟之前的不同,那么便置为NaN
print(df.reindex(list('xyz')))

# 指定某一列作为index,drop属性默认为True,即把对应的列删除
print(df.set_index("a", drop=False))

# 返回index的唯一值,即如果行索引重复,那么返回一个,如果不重复,就返回多个
print(df.set_index("a", drop=False).index.unique())

# 设置多个索引
print(df.set_index(["a", "b"], drop=False))
print(df.set_index(["a", "b"], drop=False).index.unique())  # MultiIndex([(1.0, 1.0)], names=['a', 'b'])
复合索引的取值
import pandas as pd
import numpy as np

a = pd.DataFrame(np.arange(28).reshape(7, 4), columns=list("abcd"))
print(a)

X = a.set_index(["c", "d"])['a']
print(X)        # X是Series类型

# Series的复合索引取值,直接在括号中写索引就可以了
print(X[6, 7])      # 4,如果是索引是字符串,那么需要加上双引号

# swaplevel()方式是交换里外层的索引,可以直接从里层的索引进行取值
print(X.swaplevel())
print(X.swaplevel()[7])
# print(X.swaplevel()[7, 6])
print(type(X.swaplevel()[7]))   # Series


# DataFrame复合索引
x = a.set_index(["c", "d"])[["a"]]
print(x)            # 多加了一层[]就变成DateFrame了
print(type(x))      # DataFrame

# 取值
print("*"*100)
print(x.loc[2])

print("*"*100)
print(x.loc[2].loc[3])
print(type(x.loc[2].loc[3]))    # Series

print("*"*100)
print(x.swaplevel().loc[11])

print("*"*100)

# 总结:Series的取值是用[]的形式,直接指定,而DataFrame则是需要用到Loc方法
Pandas时间序列和案例
1. 案例一
# pd.date_range(start=None, end=None, periods=None, freq='D')
#
# start和end以及freq配合能够生成start和end范围内以频率freq的一组时间索引
# start和periods以及freq配合能够生成从start开始的频率为freq的periods个时间索引
# periods指一共生成多少个时间范围

# index=pd.date_range("20170101",periods=10)
# df = pd.DataFrame(np.random.rand(10),index=index)
#
#
# 回到最开始的911数据的案例中,我们可以使用pandas提供的方法把时间字符串转化为时间序列
#
# df["timeStamp"] = pd.to_datetime(df["timeStamp"],format="")
#
# format参数大部分情况下可以不用写,但是对于pandas无法格式化的时间字符串,我们可以使用该参数,比如包含中文

# 代码如下:
import pandas as pd
import numpy as np
from matplotlib import pyplot as plt

df = pd.read_csv("./911.csv")

# 将指定列变成python的时间戳类型
df["timeStamp"] = pd.to_datetime(df["timeStamp"])

# 以时间戳作为index,方便统计
df.set_index("timeStamp", inplace=True)

# 统计911数据中不同月份的电话次数
# 注意resample方法
count_by_month = df.resample("M").count()["title"]
print(count_by_month)

# 画图
_x = count_by_month.index
_y = count_by_month.values

# 格式化x轴的刻度显示
_x = [i.strftime("%Y%m%d") for i in _x]

plt.figure(figsize=(20,8),dpi=80)

plt.plot(range(len(_x)),_y)

plt.xticks(range(len(_x)),_x,rotation=45)

plt.show()

2. 案例二
# coding=utf-8
# 911数据中不同月份不同类型的电话的次数的变化情况
import pandas as pd
import numpy as np
from matplotlib import pyplot as plt

# 把时间字符串转为时间类型设置为索引
df = pd.read_csv("./911.csv")
df["timeStamp"] = pd.to_datetime(df["timeStamp"])

# 添加列,表示分类
temp_list = df["title"].str.split(": ").tolist()
cate_list = [i[0] for i in temp_list]
# print(np.array(cate_list).reshape((df.shape[0],1)))
df["cate"] = pd.DataFrame(np.array(cate_list).reshape((df.shape[0], 1)))

df.set_index("timeStamp", inplace=True)

plt.figure(figsize=(20, 8), dpi=80)

# 分组
for group_name, group_data in df.groupby(by="cate"):
    # print(group_name)     # 三个分类
    # print(group_data)     # 数据
    # 对不同的分类都进行绘图
    count_by_month = group_data.resample("M").count()["title"]

    # 画图
    _x = count_by_month.index
    _y = count_by_month.values

    _x = [i.strftime("%Y%m%d") for i in _x]

    plt.plot(range(len(_x)), _y, label=group_name)

plt.xticks(range(len(_x)), _x, rotation=45)
plt.legend(loc="best")
plt.show()


 1万+
1万+


 被折叠的 条评论
为什么被折叠?
被折叠的 条评论
为什么被折叠?
 到【灌水乐园】发言


