


Actuator通过一系列HTTP端点提供监控能力。本文首先尝试了定义已有的endpoint,以及自定义endpoint,并实验通过prometheus对暴露的endpoint进行数据收集,Grafana进行数据展示。
添加依赖:
<dependency>
	<groupId>org.springframework.boot</groupId>
	<artifactId>spring-boot-starter-actuator</artifactId>
</dependency>
1. 端点
| 应用配置类端点 | |
|---|---|
| /beans | 获取应用程序中所创建的所有JavaBean信息 |
| /info | 返回应用自定义信息 |
| 度量指标类端点 | |
| /health | 获取应用的各类健康指标信息 |
2. 访问
HTTP访问
/actuator/
端口与路径
management.server.address
management.server.port //用于将actuator端口与应用程序端口分开,避免外部访问
暴露Endpoint
management.endpoint.web.exposure.exclude=
management.endpoint.web.exposure.include= info, health
3. 自定义已有endpoint显示信息
定义类并使其实现HealthIndicator接口,重写health()方法
package com.abc.healthcheck;

import org.springframework.boot.actuate.health.Health;
import org.springframework.boot.actuate.health.HealthIndicator;
import org.springframework.stereotype.Component;

import java.io.IOException;
import java.net.HttpURLConnection;
import java.net.URL;

@Component
public class CustomHealthIndicator implements HealthIndicator {
    @Override
    public Health health() {
        try {
            URL url = new URL("http://localhost:8080/health/");
            HttpURLConnection conn = (HttpURLConnection)url.openConnection();
            int responseCode = conn.getResponseCode();
            if (responseCode >= 200 && responseCode < 300) {
                return Health.up().build();
            }else {
                return Health.down().withDetail("HTTP Status Code", responseCode).build();
            }
        } catch (IOException e) {
            e.printStackTrace();
            Health.down().withDetail("HTTP Status Code", e.getMessage()).build();
        }
        return Health.down().withDetail("HTTP Status Code", "Unknown").build();
    }
}
4. 自定义endpoint
package com.abc.endpoint;

import org.springframework.boot.actuate.endpoint.annotation.Endpoint;
import org.springframework.boot.actuate.endpoint.annotation.ReadOperation;
import org.springframework.context.annotation.Configuration;

import java.util.HashMap;
import java.util.Map;

@Configuration
@Endpoint(id = "computername", enableByDefault = true)
public class CustomEndpoint {
    @ReadOperation
    public Map<String, Object> getMySystemInfo() {
        Map<String, Object> result = new HashMap<>();
        Map<String, String> map = System.getenv();
        result.put("computername", map.get("COMPUTERNAME"));
        return result;
    }
}
5. 监控
使用micrometer,对接prometheus实现监控功能 , 引入依赖,spring boot会自动装配相关bean
<dependency>
    <groupId>io.micrometer</groupId>
    <artifactId>micrometer-registry-prometheus</artifactId>
</dependency>
为了给Grafana(监控仪表盘)展示,需要定义如下bean
@Configuration
public class ActuatorDemoApplication {
    @Bean
    MeterRegistryCustomizer<MeterRegistry> metricsCommonTags() {
        return registry -> registry.config().commonTags("application", "actuator-demo");
    }
}
5.1 数据获取 - prometheus
架构图
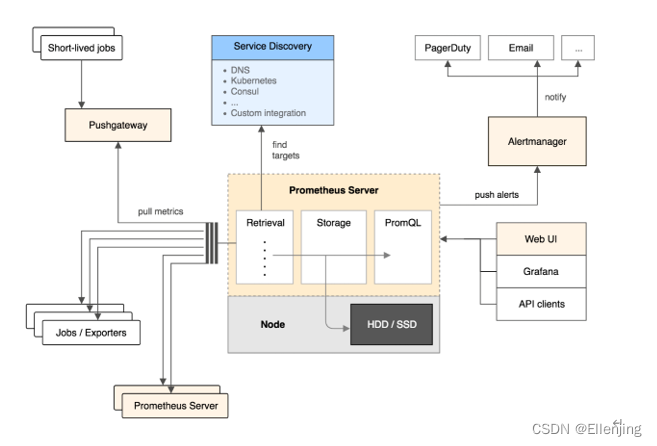
工作流程
- prometheus server可以定期从活跃的目标主机上拉取监控指标数据;也可通过pushgateway把采集的数据上报到prometheus server中;还可通过一些组件自带的exporter采集相应组件的数据
- prometheus server把采集到的监控指标数据保存到本地磁盘或者数据库;
- Prometheus采集的监控指标数据按时间序列存储,通过配置报警规则,把触发的报警发发送到alertmanager
- Alertmanager通过配置报警接收方,发送警报到邮件,微信或钉钉等
- prometheus自带的web ui提供PromQL查询语言,可查询监控数据
- Grafana可接入prometheus数据源,把监控数据以图形化形式展示出
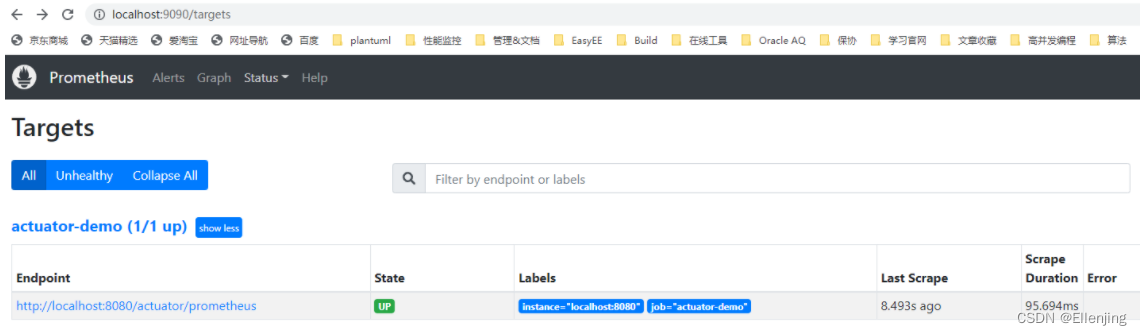
配置prometheus
配置job用于拉取监控端点的数据
scrape_configs:
  # The job name is added as a label `job=<job_name>` to any timeseries scraped from this config.
  - job_name: "actuator-demo"
    metrics_path: "actuator/prometheus"
    static_configs:
      - targets: ["localhost:8080"]
启动prometheus,后输入url: localhost:9090
5.2 数据展示 - Grafana
5.2.1 下载安装Grafana
官网:https://grafana.com/grafana/download?pg=get&plcmt=selfmanaged-box1-cta1&platform=windows
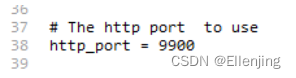
复制文件夹 安装目录 \grafana\grafana-8.5.1\conf下的sample.ini,并重命名为custom.ini,修改口号为9900
双击安装目录下的 \grafana\grafana-8.5.1\bin\grafana-server.exe 启动Grafana
登录:admin/admin
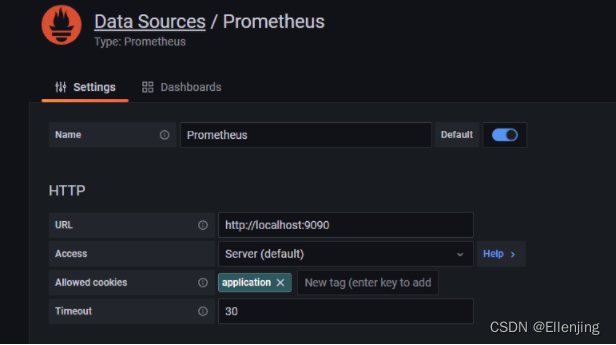
5.2.2 创建数据源prometheus
5.2.3 Importing dashboard
import dashboard from grafana.com using id: 4701 (https://grafana.com/grafana/dashboards/4701) and data sources created above
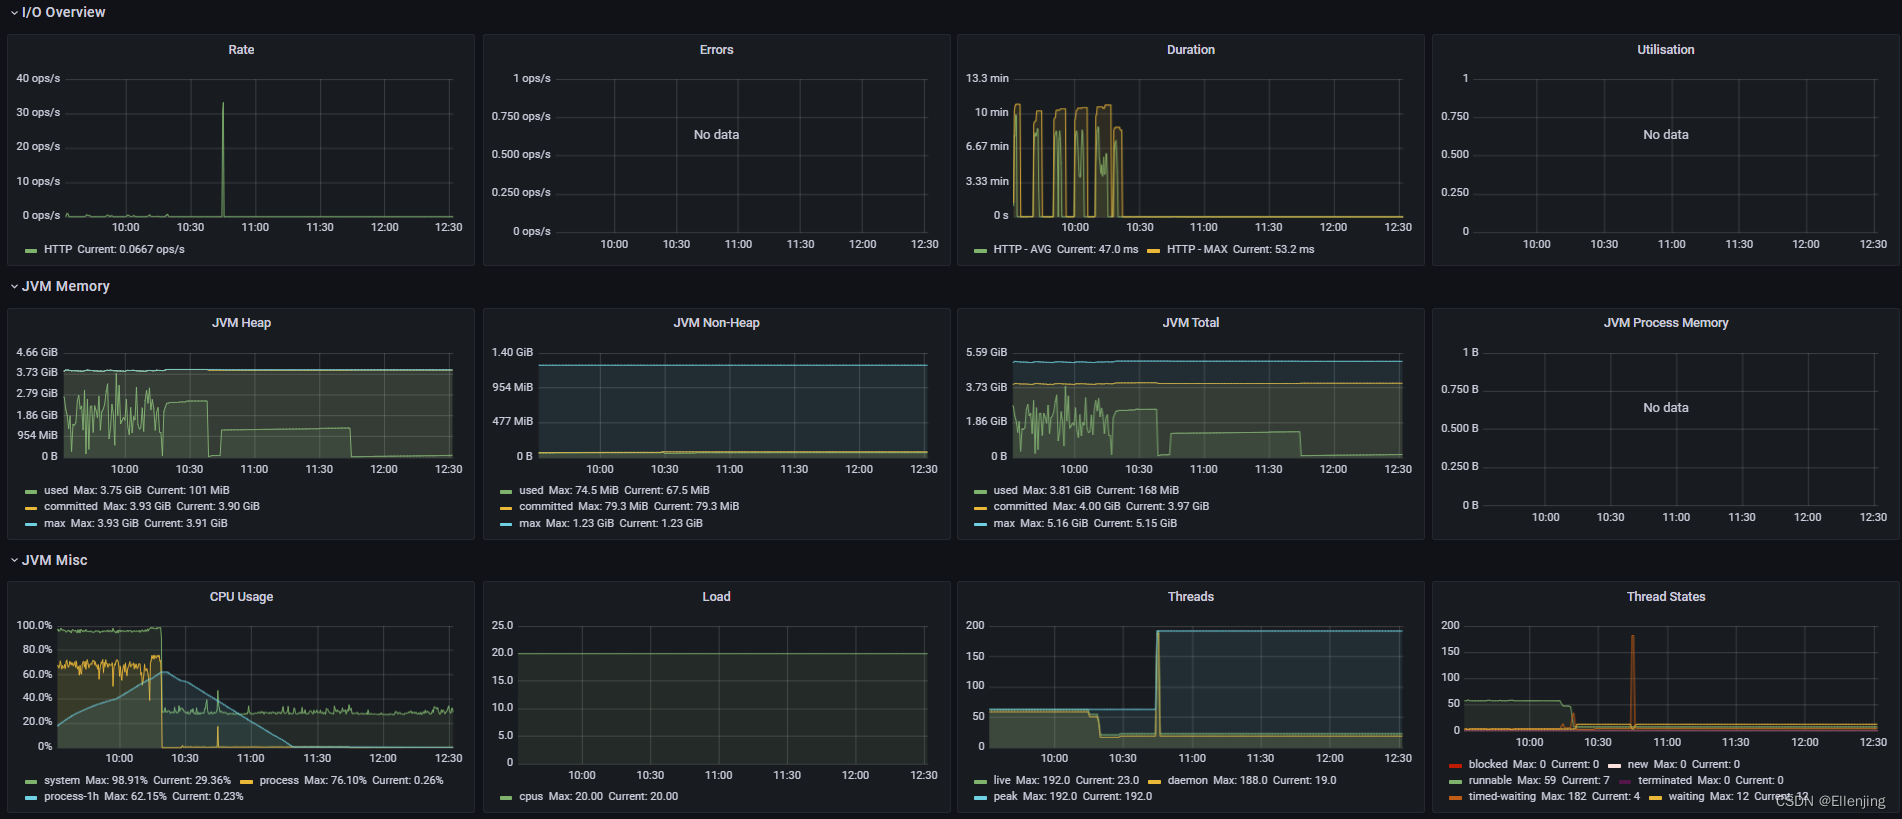
5.2.4 JVM Metrics
I/O & Memory & CPU & Threads
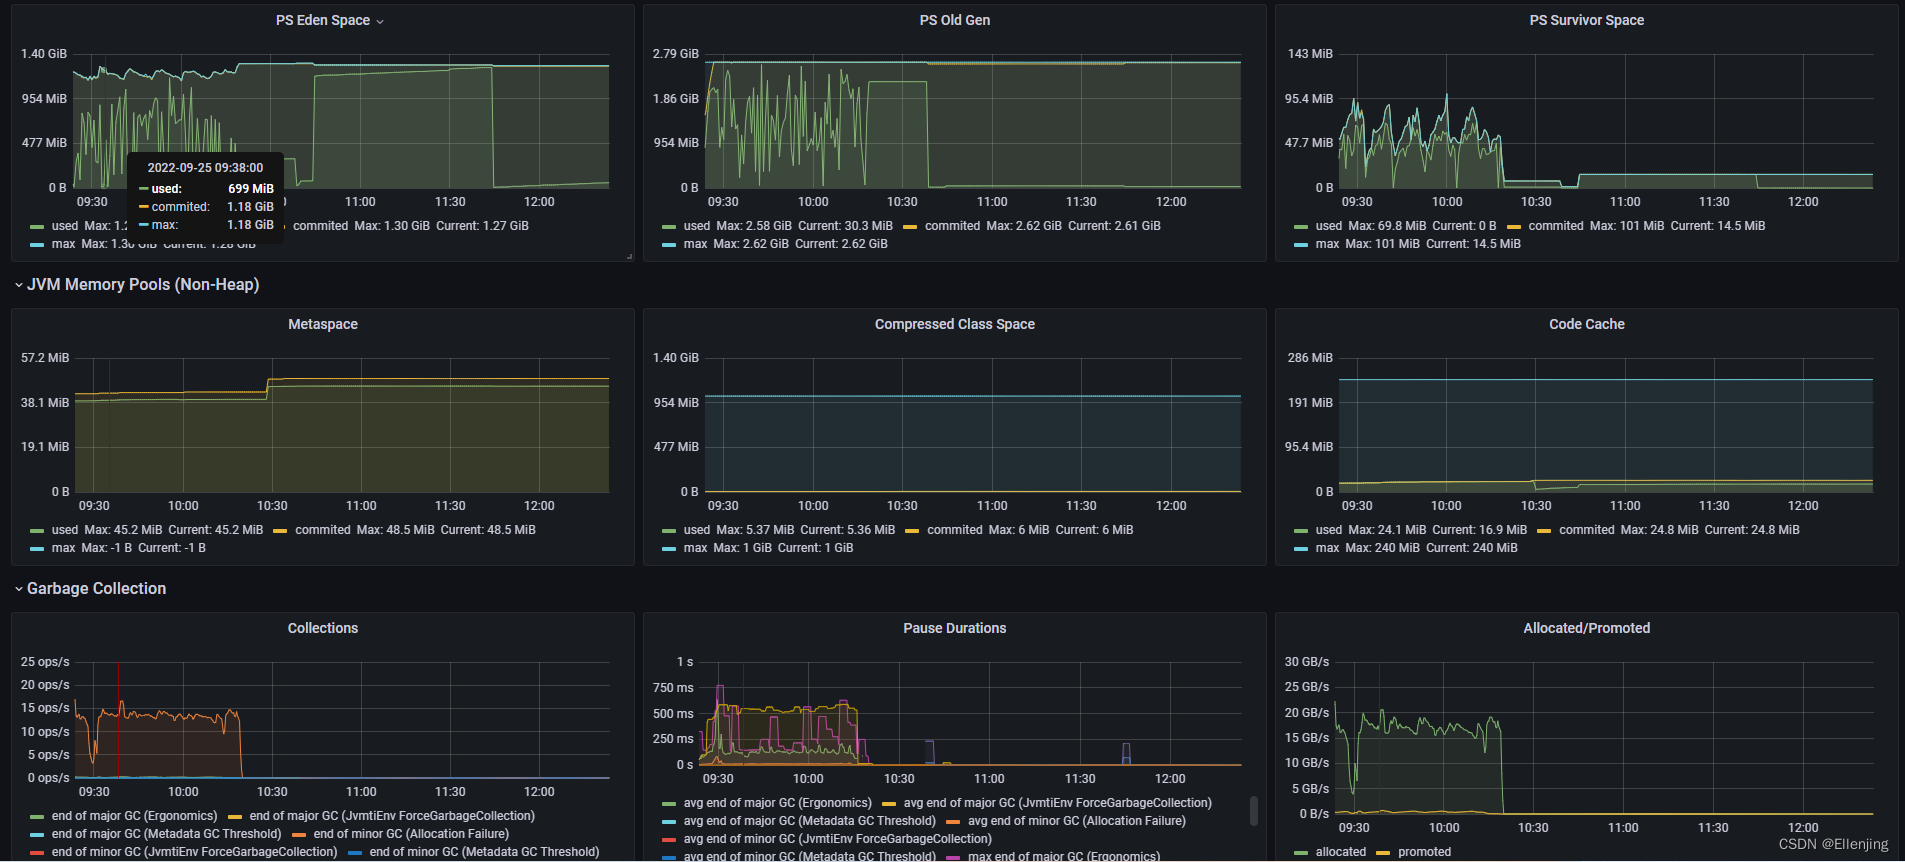
Eden space& Old Gen & Survior space & Metaspace & GC Time


 405
405


 被折叠的 条评论
为什么被折叠?
被折叠的 条评论
为什么被折叠?
 到【灌水乐园】发言


