


在anaconda prompt命令行工具下,通过pip清华镜像源安装pyecharts
pip install -i https://pypi.tuna.tsinghua.edu.cn/simple pyecharts
echarts官网:https://www.echartsjs.com/index.html
pyecharts官网:https://pyecharts.org/#/zh-cn/intro
pyecharts众多图表示例代码:https://gallery.pyecharts.org/#/README
pyecharts github项目国内镜像: https://gitee.com/mirrors/pyecharts
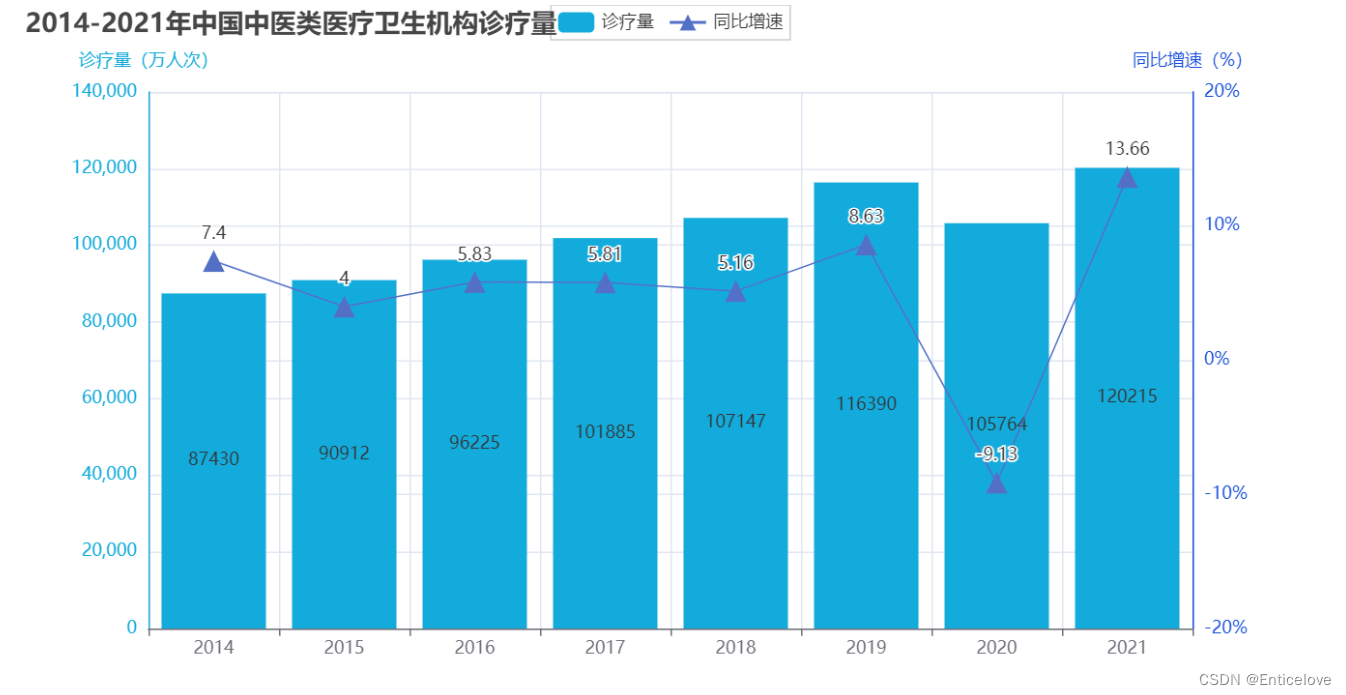
需求一:请用一张独立画布,柱形图和折线图融合在同一个坐标系展示表1数据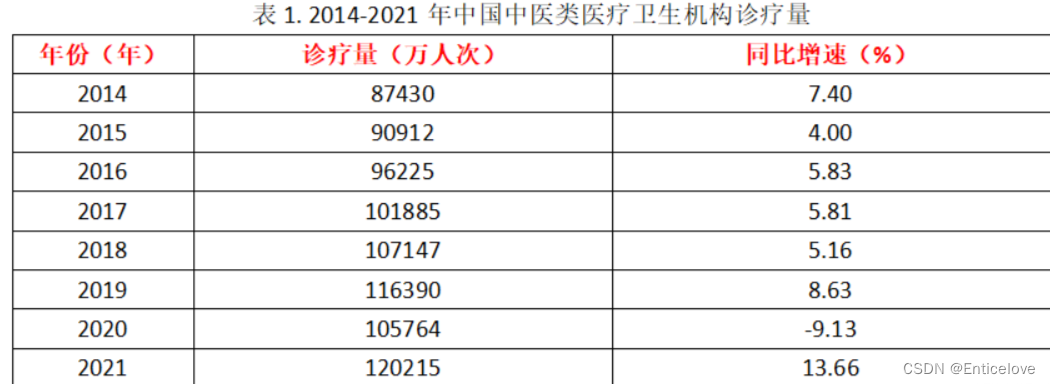
1.导入模块
#导入模块
from pyecharts import options as opts
#导入需要用到的图类表
from pyecharts.charts import Bar, Grid, Line
2.准备数据
x_data = ['2014', '2015', '2016', '2017', '2018', '2019', '2020', '2021']
x1 = [87430,90912,96225,101885,107147,116390,105764,120215]
x2 = [7.40,4.00,5.83,5.81,5.16,8.63,-9.13,13.66]
3.调用add_xaxis()和add_yaxis()为柱形图添加x轴和y轴数据
series_name:系列的名称,显示于提示框和图例中
y_axis:系列的数据,在这里面加z=0,就可以让折线图在柱形图上面
bar = (
    Bar()
    .add_xaxis(x_data)
    .add_yaxis(
                "诊疗量",
                v1,
                z=0,
                color="#5793f3"
                )
4.坐标轴配置项,坐标轴轴脊配置项,线条样式配置项,显示柱形图标签
    .extend_axis(
        yaxis=opts.AxisOpts(
                            name="同比增速(%)",
                            min_= -20, #前面要添加下划线,否则会报错
                            max_= 20,
                            axislabel_opts=opts.LabelOpts(formatter="{value}%"),
                            axisline_opts=opts.AxisLineOpts
5.线条样式配置项,显示柱形图标签,标题组件的配置项
       (
            linestyle_opts=opts.LineStyleOpts(color="#d14a61")
         ),
        )
     )
    .set_series_opts(label_opts=opts.LabelOpts(is_show=True))
    .set_global_opts
    (
        yaxis_opts=opts.AxisOpts(
                                  ame="诊疗量(万人次)",
                                  axisline_opts=opts.AxisLineOpts(
                                  linestyle_opts=opts.LineStyleOpts(color="#5793f3")
                                  )),
        title_opts=opts.TitleOpts(title="2014-2021年中国中医类医疗卫生机构诊疗量"),
        )
      )
6.创建实例,渲染图表
line = Line().add_xaxis(x_data).add_yaxis("同比增速",
                                          x2,
                                          yaxis_index=1,
                                          label_opts=opts.LabelOpts(is_show=True),
                                          symbol='triangle',
                                          symbol_size=15 )
bar.overlap(line)
bar.render_notebook()
完整代码
from pyecharts.charts import Bar, Line
from pyecharts.faker import Faker
from pyecharts import options as opts
x_data = ['2014', '2015', '2016', '2017', '2018', '2019', '2020', '2021']
x1 = [87430,90912,96225,101885,107147,116390,105764,120215]
x2 = [7.40,4.00,5.83,5.81,5.16,8.63,-9.13,13.66]
bar = (
    Bar()
    .add_xaxis(x_data)
    .add_yaxis(
                "诊疗量",
                x1,
                z=0,
                color="#13ABDB"
                )
    .extend_axis(
        yaxis=opts.AxisOpts(
                            name="同比增速(%)",
                            min_= -20, #前面要添加下划线,否则会报错
                            max_= 20,
                            axislabel_opts=opts.LabelOpts(formatter="{value}%"),
                            axisline_opts=opts.AxisLineOpts
       (
            linestyle_opts=opts.LineStyleOpts(color="#134BDB")
         ),
        )
     )
    .set_series_opts(label_opts=opts.LabelOpts(is_show=True))
    .set_global_opts
    (
        yaxis_opts=opts.AxisOpts(
                                  name="诊疗量(万人次)",
                                  axisline_opts=opts.AxisLineOpts(
                                  linestyle_opts=opts.LineStyleOpts(color="#13ABDB")
                                  )),
        title_opts=opts.TitleOpts(title="2014-2021年中国中医类医疗卫生机构诊疗量"),
        )
      )

line = Line().add_xaxis(x_data).add_yaxis("同比增速",
                                          x2,
                                          yaxis_index=1,
                                          label_opts=opts.LabelOpts(is_show=True),
                                          symbol='triangle',
                                          symbol_size=15 )
bar.overlap(line)
bar.render_notebook()
图示


 2393
2393


 被折叠的 条评论
为什么被折叠?
被折叠的 条评论
为什么被折叠?
 到【灌水乐园】发言


