


主要从四个方面来介绍Matlab二维绘图,分别是:hist函数绘制柱状图、polar函数绘制极坐标图、stem函数绘制杆状图及bar函数绘制条状图。
This tweet mainly introduces Matlab two-dimensional plotting from four aspects, namely: the HIST function draws the bar chart, the polar function plots the polar plot, the stem function plots the rod chart, and the bar function plots the bar chart.
二、思维导图(Mind Maps)

三、Matlab二维画图(Matlab two-dimensional drawing)
首先介绍一下subplot函数,这是将多个图画到一个平面上的函数,可以使用subplot(m,n,p)或者subplot(m n p)来实现。其中,m表示图排成m行,n表示图排成n列,p表示图所在的位置,p=1表示从左到右从上到下的第一个位置。例如,subplot(2,2,1)表示将绘图窗口分成两行两列四块区域,在第一块区域作图。
First, let's introduce the subplot function, which is a function that draws multiple plots onto a plane, which can be implemented using subplot(m,n,p) or subplot(m-n p). Among them, m means that the graph is arranged in m rows, n means that the graph is arranged in n columns, p represents the position where the graph is located, and p=1 represents the first position from left to right from top to bottom. For example, subplot(2,2,1) means dividing the plot window into two rows, two columns, and four areas, plotting the first area.
(一)使用hist函数绘制柱状图(Use the Hist function to plot a histogram)
hist(X,N)可以指定把X中的值分为N个等宽的类别,N是整数,若不指定,matlab会自动将数据划分所有的类别。hist(X,Y)Y是另一个向量,可以指定X中的值划分的范围,Y的长度必须为类别数加1,如果X中的值超过了Y中设置的范围,则X中的值将被放到最后一类。
hist(X,N) can specify that the values in X are divided into N equally wide categories, N is an integer, if not specified, matlab will automatically divide the data into all categories. hist(X,Y)Y is another vector that can specify the range divided by the values in X, the length of Y must be the number of categories plus 1, if the value in X exceeds the range set in Y, the value in X will be put into the last class.
代码如下:
The code is as follows:

运行结果如下:
The result of the run is as follows:

(二)使用polar函数绘制极坐标图(Use the polar function to plot polar coordinates)
polar(theta, rho, 选项):绘制极坐标图。其中,theta为极角,rho为极径,选项的内容与plot函数相同。
polar(theta, rho, option): plot polar coordinates. where theta is the polar angle, rho is the polar diameter, and the content of the option is the same as the plot function.
代码如下:The code is as follows:

运行结果如下:The result of the run is as follows:

(三)使用stem函数绘制杆状图(Use the stem function to plot a rod chart)
linspace是Matlab中的均分计算指令,用于产生x1,x2之间的N个平均点的矢量。其中x1、x2、N分别为起始值、终止值、元素个数。若默认N,默认点数为100。
linspace is an equalization calculation instruction in Matlab that is used to produce vectors of N average points between x1,x2. where x1, x2, and N are the starting value, end value, and number of elements. If the default is N, the default number of points is 100.
stem(Y) :绘制 Y 中的元素值作为垂直线段;stem(X,Y) :绘制 X 和 Y 中的元素值作为垂直线段;stem(...,linspace) :可以指定线条的属性参数。
stem(Y): Draws the element values in Y as vertical line segments; stem(X,Y): Draws element values in X and Y as vertical line segments; stem(...,linspace): You can specify attribute parameters for the line.
代码如下:
The code is as follows:

运行结果如下:
The result of the run is as follows:

(四)使用bar函数绘制条状图(Use the bar function to plot a bar chart)
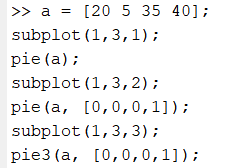
pie(X)利用向量X中的数据描绘饼图。注意,X中的数据被看做频数。饼图中比率的获得:X中的元素x[i]/sum(X)。当X中所有元素的和sum(X)< 1.0时,图形不是整一个圆。pie( X, {'...', '...', ...} )中X的意义同上,是数据向量,‘...’是标注。pie3用于描绘三维饼图。
pie(X) depicts a pie chart using data from vector X. Note that the data in X is treated as frequency, and the ratio in the pie chart is obtained: the element x[i]/sum(X) in X. When the sum of all elements in X < 1.0, the graph is not a whole circle. pie( X, {'...', '...', ...} ) The meaning of X is the same as above, it is a data vector, and '...' is an annotation. PIE3 is used to depict three-dimensional pie charts.
代码如下:
The code is as follows:
运行结果如下:
The result of the run is as follows:

![]()
今天的分享就到这里了


 285
285


 被折叠的 条评论
为什么被折叠?
被折叠的 条评论
为什么被折叠?
 到【灌水乐园】发言


