


0. 写在前面
本文是根据 matplotlib 3.7.2 版本撰写的,若出现有文章与实际有出入的情况请查看版本是否一致。
我们使用 matplotlib.pyplot 需要使用以下的语句来导入它
import matplotlib as mpl
import matplotlib.pyplot as plt
import numpy as np
1. 官方文档详解
官方给出了一个快速上手的文档 ,下面将会详细的解读官方的文档。
1.1 一个简单的例子
Matplotlib graphs your data on Figures (e.g., windows, Jupyter widgets, etc.), each of which can contain one or more Axes, an area where points can be specified in terms of x-y coordinates (or theta-r in a polar plot, x-y-z in a 3D plot, etc.). The simplest way of creating a Figure with an Axes is using pyplot.subplots. We can then use Axes.plot to draw some data on the Axes:
在这里首先要弄清楚 Figure 和 Axes 到底代表了什么。我的理解为,Figure 是一张画布,Axes 是一个个的图,一张画布中可以有多个图,而 Axes 不是坐标轴的复数的意思,在下面我还是会采用官方的 Figure 和 Axes 的说法。
Matplotlib 将数据绘制在 Figure (例如,窗口,Jupyter widgets 等)上,每个图形都可以包含一个或多个 Axes ,一个可以用横纵坐标确定点的区域(或极坐标中的 theta-r, 3D 图中的 x-y-z 等)。创建带有轴的图形的最简单方法是使用 pyplot.subplots。然后我们可以使用 Axes.plot,在 Axes 上绘制一些数据,如下所示:
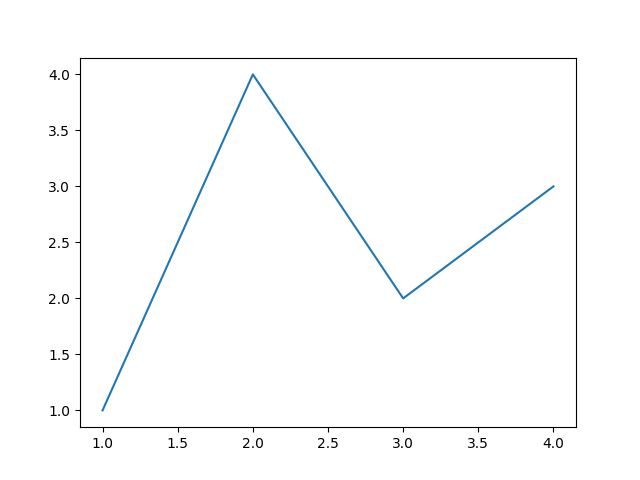
代码部分:
import matplotlib.pyplot as plt
import numpy as np
fig, ax = plt.subplots()  # 创建了带有一个图的 Figure
ax.plot([1, 2, 3, 4], [1, 4, 2, 3])  # 在这个图中放入一些数据
plt.show() # 让这个图展示出来
效果如下图所示:
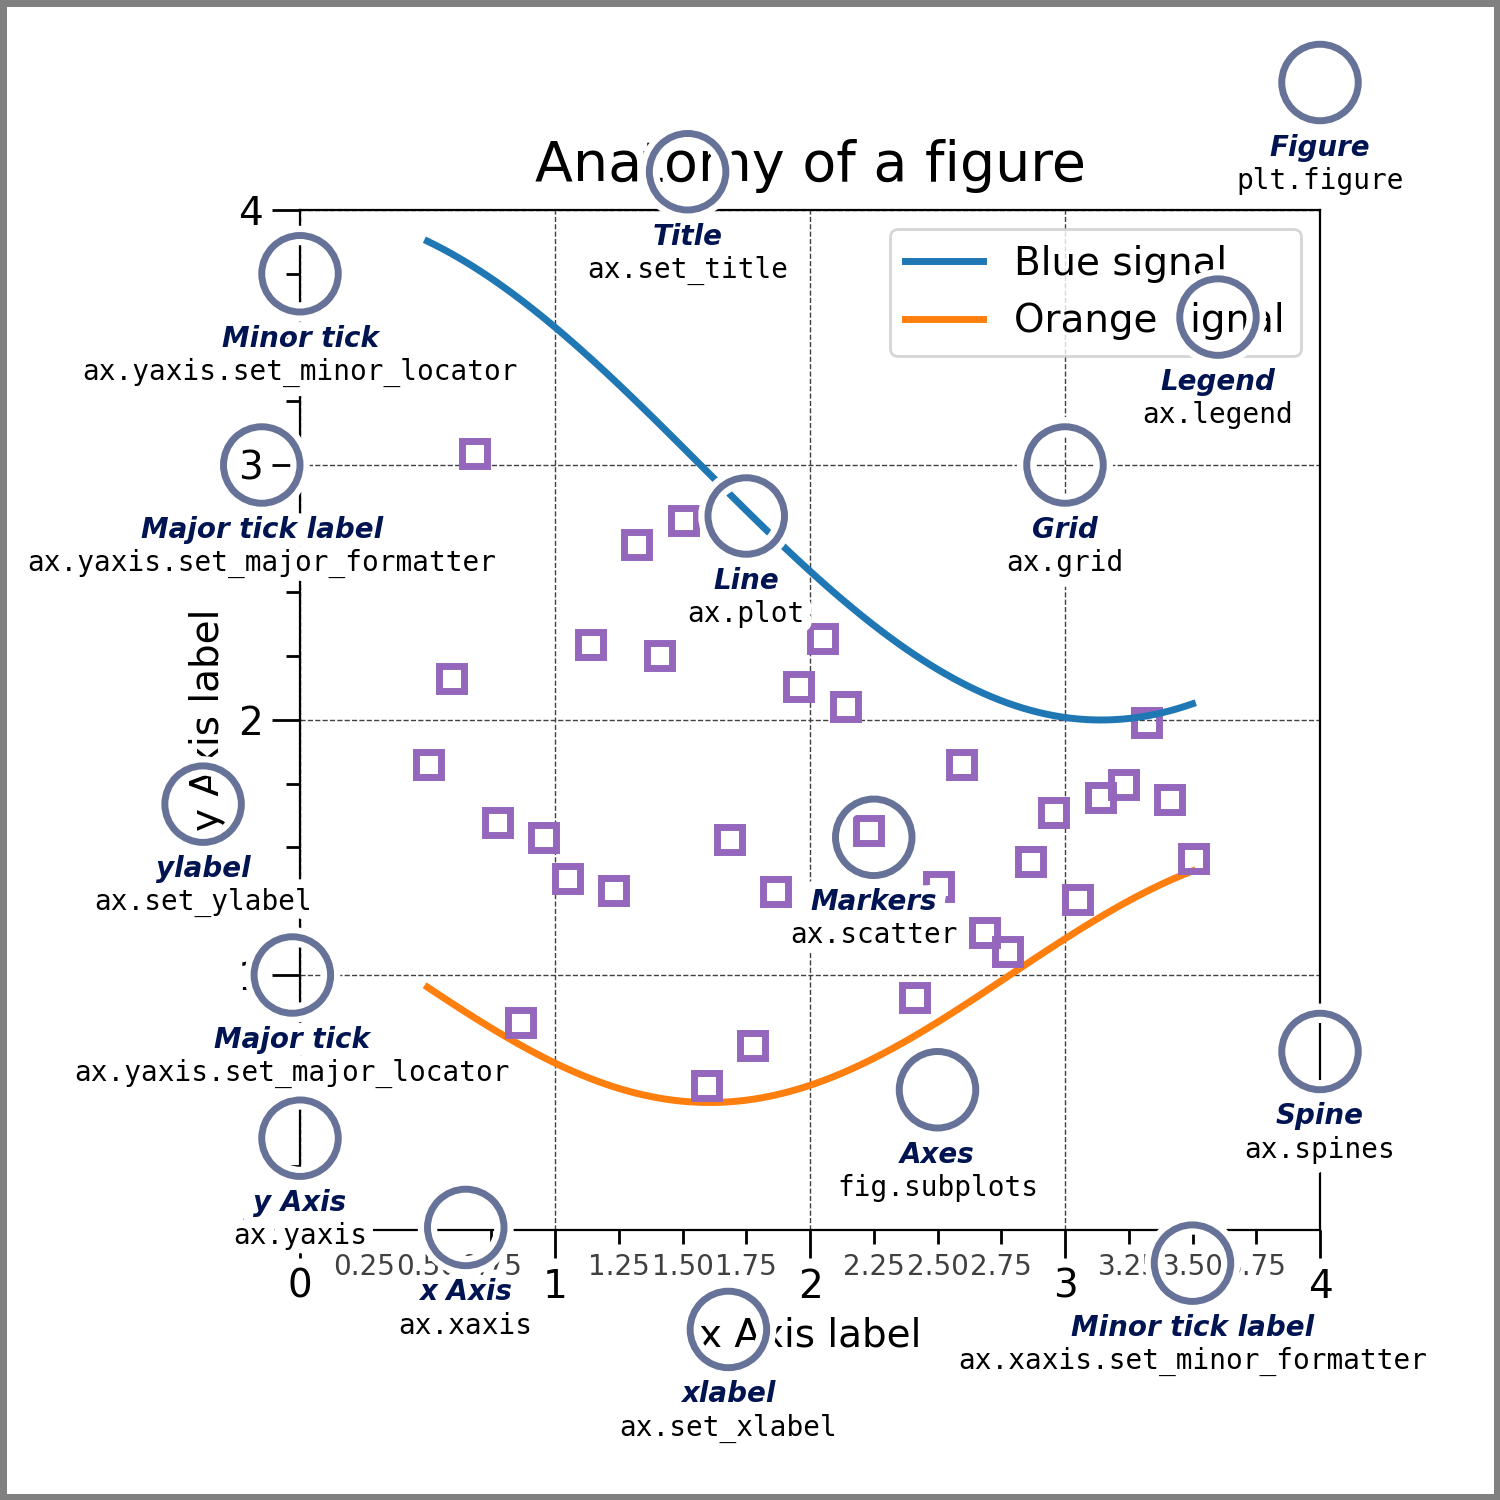
1.2 Figure 的组成
如下的图展示了 Figure 的组成,以及各个组成成分的名字,若在后续的文章中遇到了直接使用英语表达的地方,可以来这一张图中找到答案
1.2.1 Artists
Basically, everything visible on the Figure is an Artist (even Figure, Axes, and Axis objects). This includes Text objects, Line2D objects, collections objects, Patch objects, etc. When the Figure is rendered, all of the Artists are drawn to the canvas. Most Artists are tied to an Axes; such an Artist cannot be shared by multiple Axes, or moved from one to another.
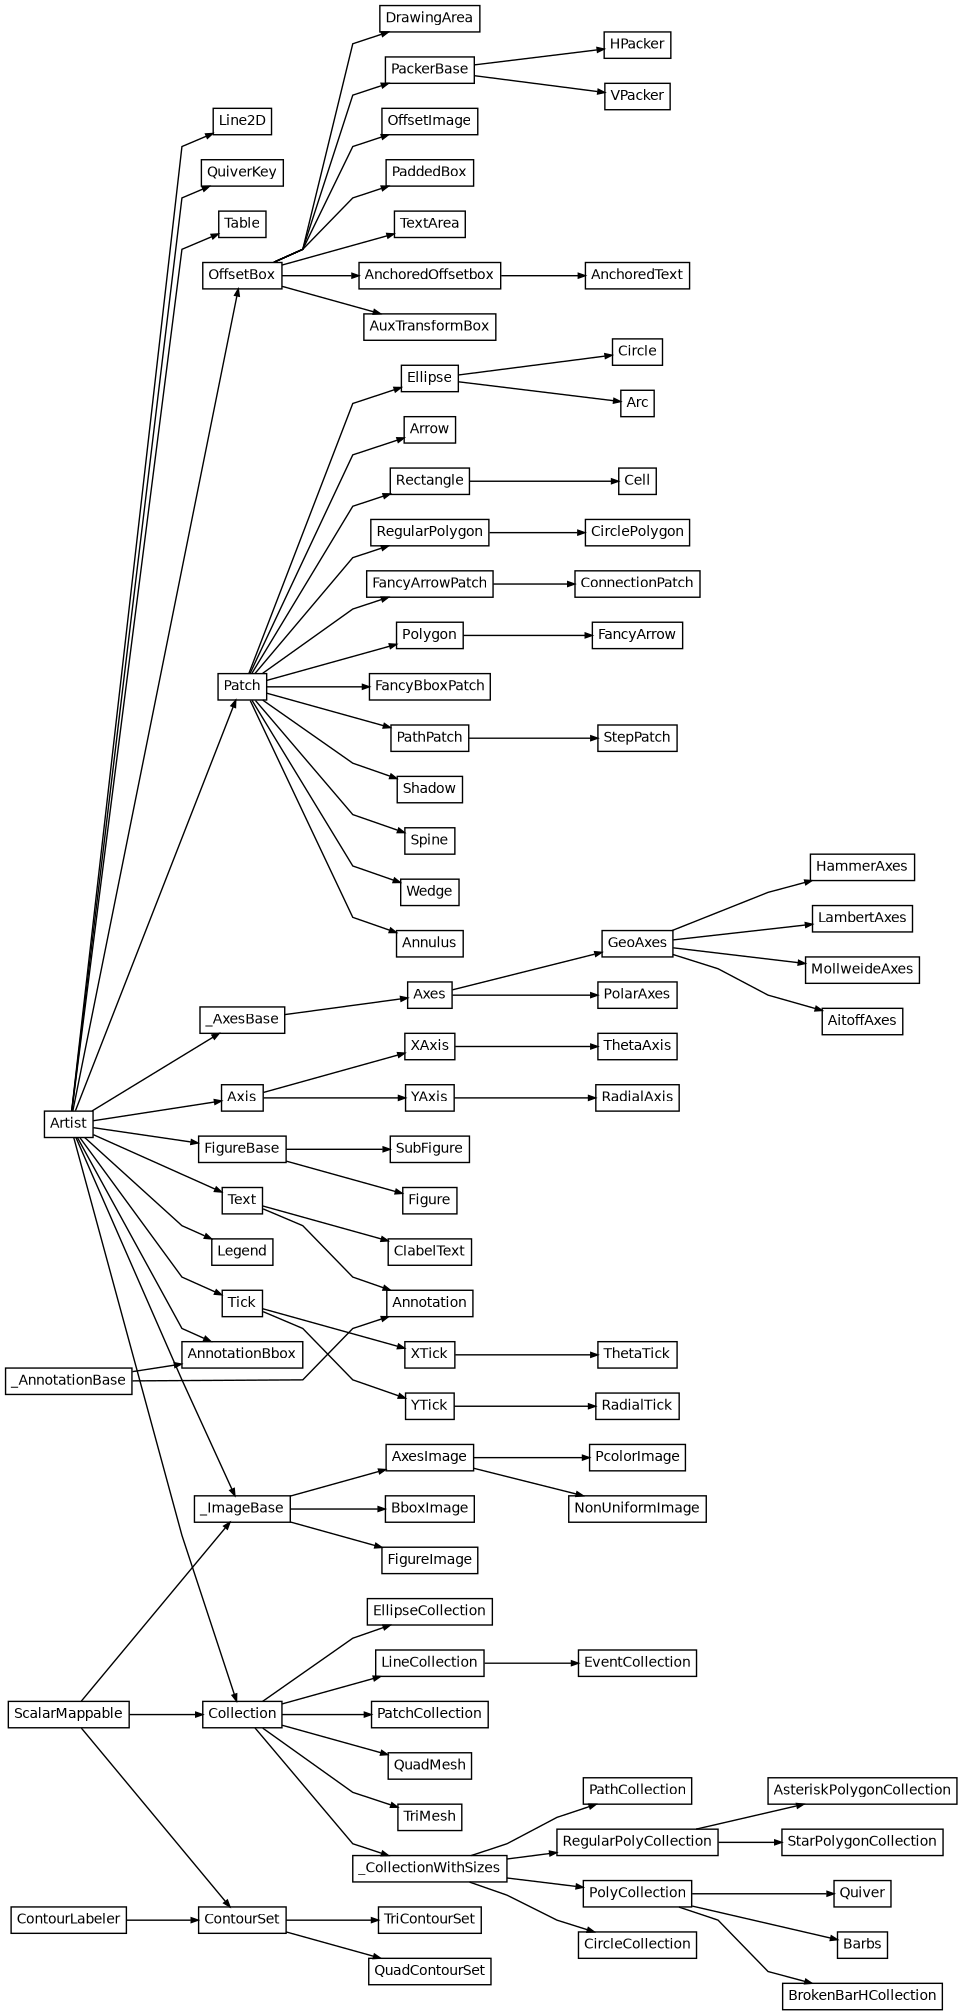
基本上所有在 Figure 上可见的元素都是一个 Artists (甚至是 Figure 、Axes 和 Axis 对象)。这些包含了 Text 对象、Line2D 对象、 collections 对象、Patch 对象等。当 Figure 被渲染后,所有的 Artists 都被绘制到画布上。大多数的 Artists 都被绑定了Axes ,所以一个 Artists 不能被多个 Axes 共享,也不能从一个 Axes 移动到另一个 Axes (所以在一个 Figure 中存在多个Axes时,最好是采用 ax.plot() 的方式绘图)。可以理解为 Artists 是大多数元素的基类,事实亦是如此。下图为Artists 的继承关系图,来自 matplotlib.artist
1.2.2 Figure
The whole figure. The Figure keeps track of all the child Axes, a group of ‘special’ Artists (titles, figure legends, colorbars, etc), and even nested subfigures.
The easiest way to create a new Figure is with pyplot:
Figure 可以控制所有的子 Axes,它包含了一组特殊的 Artists(titles、figure、legends、colorbars 等 )甚至是他们的子 figure
下面是使用 pyplot 创建一个 Figure 最简单的方式:
fig = plt.figure()  # 创建了一个空的 Figure
fig, ax = plt.subplots()  # 创建了带有一个 Axes 的 Figure
fig, axs = plt.subplots(2, 2)  # 创建了带有 2x2 的 Axes 的 Figure
# 创建了左边有一个 Axes 右边有两个 Axes 的 Figure:
fig, axs = plt.subplot_mosaic([['left', 'right-top'],
                               ['left', 'right_bottom']])
It is often convenient to create the Axes together with the Figure, but you can also manually add Axes later on. Note that many Matplotlib backends support zooming and panning on figure windows.
与 Figure 一起创建 Axes 通常很方便,我们也可以后续手动的添加坐标轴。而且很多 matplotlib 后端都支持在窗口上进行缩放和平移
1.2.3 Axes
An Axes is an Artist attached to a Figure that contains a region for plotting data, and usually includes two (or three in the case of 3D) Axis objects (be aware of the difference between Axes and Axis) that provide ticks and tick labels to provide scales for the data in the Axes. Each Axes also has a title (set via set_title()), an x-label (set via set_xlabel()), and a y-label set via set_ylabel()).
Axes 是依附在 包含绘图数据区域 Figure 上的 Artist,Axes 通常包括两个(在 3D 下是三个) Axis 对象(请注意 Axes 和 Axis 之间的区别), Axis 对象提供刻度和刻度标签,以确定坐标轴中数据按照多少刻度进行显示。每个 Axes 也有标题,可以通过 set_title() 进行设置,一个 x 标签通过 set_xlabel() 设置,和一个 y 标签通过 set_ylabel() 设置
The Axes class and its member functions are the primary entry point to working with the OOP interface, and have most of the plotting methods defined on them (e.g. ax.plot(), shown above, uses the plot method)
Axes 类及其成员方法是面向对象编程接口的主要入口点,并在他们中定义了很多绘图方法(例如, ax.plot() 就使用了plot方法)
1.2.4 Axis
These objects set the scale and limits and generate ticks (the marks on the Axis) and ticklabels (strings labeling the ticks). The location of the ticks is determined by a Locator object and the ticklabel strings are formatted by a Formatter. The combination of the correct Locator and Formatter gives very fine control over the tick locations and labels.
Axis 对象设置比例和坐标轴范围,并生成 ticks(轴上的标记)和 ticklabels(标记刻度的字符串)。标记的位置由 Locator 对象确定,ticklabel 字符串由 Formatter 格式化。正确的 Locator 和 Formatter 的组合可以很好地控制 ticks 的位置和 ticklabels
1.3 绘图函数的输入
Plotting functions expect numpy.array or numpy.ma.masked_array as input, or objects that can be passed to numpy.asarray. Classes that are similar to arrays (‘array-like’) such as pandas data objects and numpy.matrix may not work as intended. Common convention is to convert these to numpy.array objects prior to plotting. For example, to convert a numpy.matrix
绘图函数希望接收 numpy.array 或 numpy.ma.masked_array 作为输入,或者是可以传递给 numpy.asarray 的对象。类似于数组的类、或者像数组的类。如 pandas 数据对象和 numpy.matrix 可能无法按预期工作。常见的做法是在绘制之前将它们转换为numpy.array。例如,转换 numpy.matrix:
b = np.matrix([[1, 2], [3, 4]])
b_asarray = np.asarray(b)
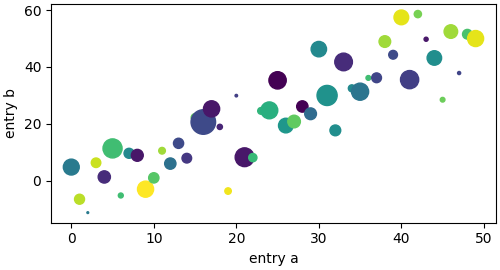
Most methods will also parse an addressable object like a dict, a numpy.recarray, or a pandas.DataFrame. Matplotlib allows you to provide the data keyword argument and generate plots passing the strings corresponding to the x and y variables.
大多数方法还将解析可寻址对象,如 dict、numpy.recarray 或 pandas.DataFrame。Matplotlib 允许使用 data 的 key 作为参数,并将其中的值分别作为 x 轴和 y 轴来生成图像:
np.random.seed(19680801)  # 设置随机种子
data = {'a': np.arange(50),
        'c': np.random.randint(0, 50, 50),
        'd': np.random.randn(50)}
data['b'] = data['a'] + 10 * np.random.randn(50)
data['d'] = np.abs(data['d']) * 100

fig, ax = plt.subplots(figsize=(5, 2.7), layout='constrained')
ax.scatter('a', 'b', c='c', s='d', data=data)# 这里就使用了data['a']的数据作为 x 轴,data['y']的数据作为 y 轴
ax.set_xlabel('entry a')
ax.set_ylabel('entry b')
1.4 编程风格
1.4.1 隐式和显式接口
As noted above, there are essentially two ways to use Matplotlib:
- Explicitly create Figures and Axes, and call methods on them (the “object-oriented (OO) style”).
- Rely on pyplot to implicitly create and manage the Figures and Axes, and use pyplot functions for plotting.
See Matplotlib Application Interfaces (APIs) for an explanation of the tradeoffs between the implicit and explicit interfaces.
如上所述,基本上有两种使用Matplotlib的方法:
- 显式地创建
Figures和Axes,并调用它们的方法(面向对象的风格) - 依靠 pyplot 隐式地创建和管理
Figures和Axes,并使用 pyplot 函数进行绘图。
更多的信息可以参考 Matplotlib 应用程序接口(api),了解隐式和显式接口更多的信息
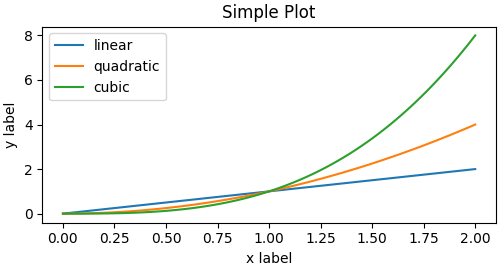
一个图可以使用显式的方式或者隐式的方式完成
下面是显式的方式:
x = np.linspace(0, 2, 100)  # 可以理解为图像的精度,这里代表0-2之间有100个点

fig, ax = plt.subplots(figsize=(5, 2.7), layout='constrained')
ax.plot(x, x, label='linear')
ax.plot(x, x**2, label='quadratic')
ax.plot(x, x**3, label='cubic')
ax.set_xlabel('x label')  # 在 Axes 中添加 x 轴的标签
ax.set_ylabel('y label')  # 在 Axes 中添加 y 轴的标签
ax.set_title("Simple Plot")  # 在 Axes 中添加标题
ax.legend()
plt.show()
下面是隐式的方式
x = np.linspace(0, 2, 100)  # 可以理解为图像的精度,这里代表0-2之间有100个点

plt.figure(figsize=(5, 2.7), layout='constrained')
plt.plot(x, x, label='linear')
plt.plot(x, x**2, label='quadratic')
plt.plot(x, x**3, label='cubic')
plt.xlabel('x label')
plt.ylabel('y label')
plt.title("Simple Plot")
plt.legend()
plt.show()
(In addition, there is a third approach, for the case when embedding Matplotlib in a GUI application, which completely drops pyplot, even for figure creation. See the corresponding section in the gallery for more info: Embedding Matplotlib in graphical user interfaces.)
此外,还有第三种方法,用于在 GUI 应用程序中嵌入 Matplotlib 的情况,甚至为了图形创建,完全放弃了 pyplot,。更多信息请参见图库中的相应部分:在图形用户界面中嵌入 Matplotlib(这里我也没看太懂,如果有写错的地方欢迎大家指正)
Matplotlib’s documentation and examples use both the OO and the pyplot styles. In general, we suggest using the OO style, particularly for complicated plots, and functions and scripts that are intended to be reused as part of a larger project. However, the pyplot style can be very convenient for quick interactive work.
Matplotlib 的文档和示例同时使用了面向对象和 pyplot 的风格。一般来说,建议使用面向对象的风格,特别是对于复杂的图形、功能和脚本,它们可能会在一个大型项目中被复用。不过 pyplot 风格对于快速交互工作非常方便


 1561
1561


 被折叠的 条评论
为什么被折叠?
被折叠的 条评论
为什么被折叠?
 到【灌水乐园】发言


