


回归类的模型评估指标
回归类算法的模型评估一直都是回归算法中的一个难点,但不像我们曾经讲过的无监督学习算法中的轮廓系数等等评估指标,回归类与分类型算法的模型评估其实是相似的法则——找真实标签和预测值的差异。只不过在分类型算法中,这个差异只有一种角度来评判,那就是是否预测到了正确的分类,而在我们的回归类算法中,我们有两种不同的角度来看待回归的效果:
第一,我们是否预测到了正确的数值。
第二,我们是否拟合到了足够的信息。
这两种角度,分别对应着不同的模型评估指标。
1 是否预测了正确的数值
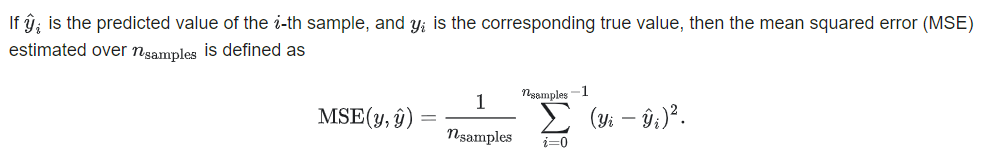
均方误差MSE(mean squared error)

from  sklearn.metrics import  mean_squared_error as MSE
mse=MSE(yhat,Ytest)
print(mse)

from sklearn.model_selection import cross_val_score
#当scoring='mean_squared_error'会报错了
cv_mse=cross_val_score(reg,X,y,scoring='neg_mean_squared_error')
print(cv_mse)
线性回归的大坑一号:均方误差为负
虽然均方误差永远为正,但是sklearn中的参数scoring下,均方误差作为评判标准时,却是计算”负均方误差neg_mean_squared_error)。这是因为sklearn在计算模型评估指标的时候,会考虑指标本身的性质,均方误差本身是一种误差,所以被sklearn划分为模型的一种损失(loss)。在sklearn当中,所有的损失都使用负数表示,因此均方误差也被显示为负数了。真正的均方误差MSE的数值,其实就是neg_mean_squared_error去掉负号的数字。
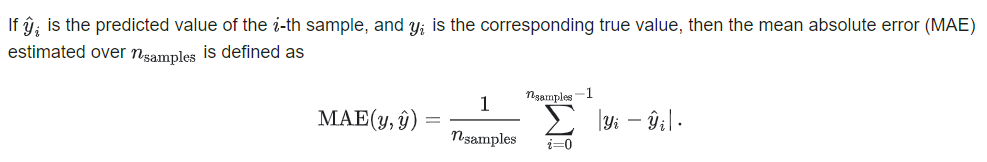
绝对均值误差MAE(Mean absolute error)

2 是否拟合了足够的信息


R
2
R^2
R2


from sklearn.metrics import r2_score
m_r2=r2_score(yhat,Ytest)
print(m_r2) #0.33806537615559895

r2=reg.score(Xtest,Ytest)
print(r2)   #0.6043668160178816
线性回归的大坑二号:相同的评估指标不同的结果

r2 = reg.score(Xtest, Ytest)
print(r2)  # 0.6043668160178816

# 正确的调用方式
r2 = r2_score(Ytest, yhat)
# 或者
# r2=r2_score(y_true=Ytest,y_pred=yhat)
print(r2)   #0.6043668160178816

r2 = cross_val_score(reg, X, y, cv=10, scoring='r2').mean()
print(r2)   #0.5110068610524554

import matplotlib.pyplot as plt
sorted(Ytest)
plt.plot(range(len(Ytest)),sorted(Ytest),c="black",label= "Data")
plt.plot(range(len(yhat)),sorted(yhat),c="red",label = "Predict")
plt.legend()
plt.show()


现在,来看一组有趣的情况:
import numpy as np
rng = np.random.RandomState(42)
X = rng.randn(100, 80)
y = rng.randn(100)
r2=cross_val_score(LR(), X, y, cv=5, scoring='r2')
print(r2)
#[-179.86577271   -5.69860535  -15.10281588  -78.21750079  -70.19186257]
线性回归的三号大坑:负的 R 2 R^2 R2


'''
模型效果指标评估
y_true:真实的数据值
y_pred:回归模型预测的数据值
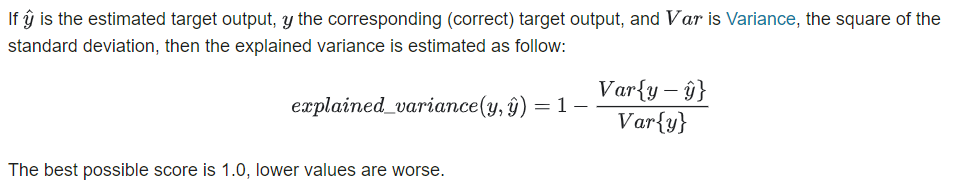
explained_variance_score:解释回归模型的方差得分,其值取值范围是[0,1],越接近于1说明自变量越能解释因变量
的方差变化,值越小则说明效果越差。
mean_absolute_error:平均绝对误差(Mean Absolute Error,MAE),用于评估预测结果和真实数据集的接近程度的程度
,其其值越小说明拟合效果越好。
mean_squared_error:均方差(Mean squared error,MSE),该指标计算的是拟合数据和原始数据对应样本点的误差的
平方和的均值,其值越小说明拟合效果越好。
r2_score:判定系数,其含义是也是解释回归模型的方差得分,其值取值范围是[0,1],越接近于1说明自变量越能解释因
变量的方差变化,值越小则说明效果越差。
explained_variance_score解释方差的得分
Parameters:
	y_true : array-like of shape = (n_samples) or (n_samples, n_outputs)
			Ground truth (correct) target values.

	y_pred : array-like of shape = (n_samples) or (n_samples, n_outputs)
			Estimated target values.

	sample_weight : array-like of shape = (n_samples), optional
			Sample weights.

	multioutput : string in [‘raw_values’, ‘uniform_average’, ‘variance_weighted’] 				or array-like of shape (n_outputs)
			Defines aggregating of multiple output scores. Array-like value defines 	weights used to average scores.

	‘raw_values’ :
			Returns a full set of scores in case of multioutput input.

	‘uniform_average’ :
		Scores of all outputs are averaged with uniform weight.

	‘variance_weighted’ :
		Scores of all outputs are averaged, weighted by the variances of each individual 	output.

Returns:
score : float or ndarray of floats
The explained variance or ndarray if ‘multioutput’ is ‘raw_values’.
>>> from sklearn.metrics import explained_variance_score
>>> y_true = [3, -0.5, 2, 7]
>>> y_pred = [2.5, 0.0, 2, 8]
>>> explained_variance_score(y_true, y_pred)
0.957...
>>> y_true = [[0.5, 1], [-1, 1], [7, -6]]
>>> y_pred = [[0, 2], [-1, 2], [8, -5]]
>>> explained_variance_score(y_true, y_pred, multioutput='uniform_average')
...
0.983...
mean_absolute_error平均绝对误差
是绝对误差的平均值
能更好地反映预测值误差的实际情况.
sklearn.metrics.mean_absolute_error(y_true, y_pred, sample_weight=None, multioutput=’uniform_average’)


Parameters:
	y_true : array-like of shape = (n_samples) or (n_samples, n_outputs)
	Ground truth (correct) target values.

	y_pred : array-like of shape = (n_samples) or (n_samples, n_outputs)
	Estimated target values.

	sample_weight : array-like of shape = (n_samples), optional
	Sample weights.

	multioutput : string in [‘raw_values’, ‘uniform_average’]
	or array-like of shape (n_outputs) Defines aggregating of multiple output values. Array-like value defines weights used to average errors.

	‘raw_values’ :
	Returns a full set of errors in case of multioutput input.

	‘uniform_average’ :
	Errors of all outputs are averaged with uniform weight.

Returns:
	loss : float or ndarray of floats
	If multioutput is ‘raw_values’, then mean absolute error is returned for each output separately. If multioutput is ‘uniform_average’ or an ndarray of weights, then the weighted average of all output errors is returned.

	MAE output is non-negative floating point. The best value is 0.0.
Examples
>>> from sklearn.metrics import mean_absolute_error
>>> y_true = [3, -0.5, 2, 7]
>>> y_pred = [2.5, 0.0, 2, 8]
>>> mean_absolute_error(y_true, y_pred)
0.5
>>> y_true = [[0.5, 1], [-1, 1], [7, -6]]
>>> y_pred = [[0, 2], [-1, 2], [8, -5]]
>>> mean_absolute_error(y_true, y_pred)
0.75
>>> mean_absolute_error(y_true, y_pred, multioutput='raw_values')
array([0.5, 1. ])
>>> mean_absolute_error(y_true, y_pred, multioutput=[0.3, 0.7])
...
0.85...
mean_squared_error 均方误差
sklearn.metrics.mean_squared_error(y_true, y_pred, sample_weight=None, multioutput=’uniform_average’)


Parameters:
		y_true : array-like of shape = (n_samples) or (n_samples, n_outputs)
		Ground truth (correct) target values.

		y_pred : array-like of shape = (n_samples) or (n_samples, n_outputs)
		Estimated target values.

		sample_weight : array-like of shape = (n_samples), optional
		Sample weights.

		multioutput : string in [‘raw_values’, ‘uniform_average’]
		or array-like of shape (n_outputs) Defines aggregating of multiple output values. Array-like value defines weights used to average errors.

		‘raw_values’ :
		Returns a full set of errors in case of multioutput input.

		‘uniform_average’ :
		Errors of all outputs are averaged with uniform weight.

Returns:
	loss : float or ndarray of floats
	A non-negative floating point value (the best value is 0.0), or an array of floating point values, one for each individual target.
Examples:
>>> from sklearn.metrics import mean_squared_error
>>> y_true = [3, -0.5, 2, 7]
>>> y_pred = [2.5, 0.0, 2, 8]
>>> mean_squared_error(y_true, y_pred)
0.375
>>> y_true = [[0.5, 1],[-1, 1],[7, -6]]
>>> y_pred = [[0, 2],[-1, 2],[8, -5]]
>>> mean_squared_error(y_true, y_pred)
0.708...
>>> mean_squared_error(y_true, y_pred, multioutput='raw_values')
...
array([0.41666667, 1.        ])
>>> mean_squared_error(y_true, y_pred, multioutput=[0.3, 0.7])
...
0.825...
r2_score

sklearn.metrics.r2_score(y_true, y_pred, sample_weight=None, multioutput=’uniform_average’)

Parameters:
		y_true : array-like of shape = (n_samples) or (n_samples, n_outputs)
		Ground truth (correct) target values.

		y_pred : array-like of shape = (n_samples) or (n_samples, n_outputs)
		Estimated target values.

		sample_weight : array-like of shape = (n_samples), optional
		Sample weights.

		multioutput : string in [‘raw_values’, ‘uniform_average’, ‘variance_weighted’] or None or array-like of shape (n_outputs)
		Defines aggregating of multiple output scores. Array-like value defines weights used to average scores. Default is “uniform_average”.

		‘raw_values’ :
		Returns a full set of scores in case of multioutput input.

		‘uniform_average’ :
		Scores of all outputs are averaged with uniform weight.

		‘variance_weighted’ :
		Scores of all outputs are averaged, weighted by the variances of each individual output.

		Changed in version 0.19: Default value of multioutput is ‘uniform_average’.

Returns:
	z : float or ndarray of floats
	The R^2 score or ndarray of scores if ‘multioutput’ is ‘raw_values’.
Examples
>>> from sklearn.metrics import r2_score
>>> y_true = [3, -0.5, 2, 7]
>>> y_pred = [2.5, 0.0, 2, 8]
>>> r2_score(y_true, y_pred)
0.948...
>>> y_true = [[0.5, 1], [-1, 1], [7, -6]]
>>> y_pred = [[0, 2], [-1, 2], [8, -5]]
>>> r2_score(y_true, y_pred,
...          multioutput='variance_weighted')
0.938...
>>> y_true = [1, 2, 3]
>>> y_pred = [1, 2, 3]
>>> r2_score(y_true, y_pred)
1.0
>>> y_true = [1, 2, 3]
>>> y_pred = [2, 2, 2]
>>> r2_score(y_true, y_pred)
0.0
>>> y_true = [1, 2, 3]
>>> y_pred = [3, 2, 1]
>>> r2_score(y_true, y_pred)
-3.0
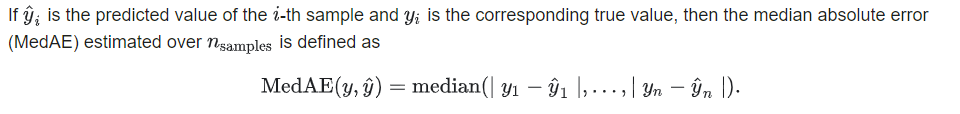
Median absolute error绝对中位差
是绝对误差的平均值
能更好地反映预测值误差的实际情况.
sklearn.metrics.median_absolute_error(y_true, y_pred)

Parameters:
	y_true : array-like of shape = (n_samples)
	Ground truth (correct) target values.

	y_pred : array-like of shape = (n_samples)
	Estimated target values.

Returns:
	loss : float
	A positive floating point value (the best value is 0.0).
>>> from sklearn.metrics import median_absolute_error
>>> y_true = [3, -0.5, 2, 7]
>>> y_pred = [2.5, 0.0, 2, 8]
>>> median_absolute_error(y_true, y_pred)
0.5
补充:
-
RMSE
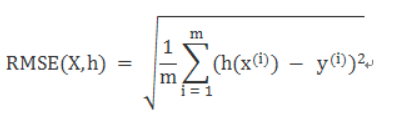
Root Mean Square Error,均方根误差
是观测值与真值偏差的平方和与观测次数m比值的平方根。
是用来衡量观测值同真值之间的偏差 -
标准差
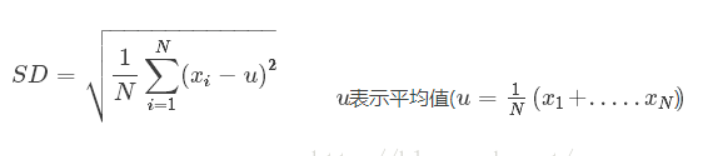
Standard Deviation ,标准差
是方差的算数平方根
是用来衡量一组数自身的离散程度
RMSE与标准差对比:标准差是用来衡量一组数自身的离散程度,而均方根误差是用来衡量观测值同真值之间的偏差,它们的研究对象和研究目的不同,但是计算过程类似。
RMSE与MAE对比:RMSE相当于L2范数,MAE相当于L1范数。次数越高,计算结果就越与较大的值有关,而忽略较小的值,所以这就是为什么RMSE针对异常值更敏感的原因(即有一个预测值与真实值相差很大,那么RMSE就会很大)。


 3280
3280


 被折叠的 条评论
为什么被折叠?
被折叠的 条评论
为什么被折叠?
 到【灌水乐园】发言


