


目录
filebeat远程收集nginx、httpd、mysqld日志
ELK概念
ELK是一套完整的日志集中处理方案。
E:ElasticSearck 简称ES 分布式索引型非关系型数据库,用来存储logstash输出的日志 ,它是一个全文检索引擎,保存的格式是json格式
L:logstash 是基于Java语言开发的,用来作数据收集引擎、日志的收集。可以对数据进行过滤,分析,汇总,以标准格式输出
K:Kibana 是ES的可视化工具,对ES存储的数据进行可视化展示,分析和检索。
ELK实验
数据流向
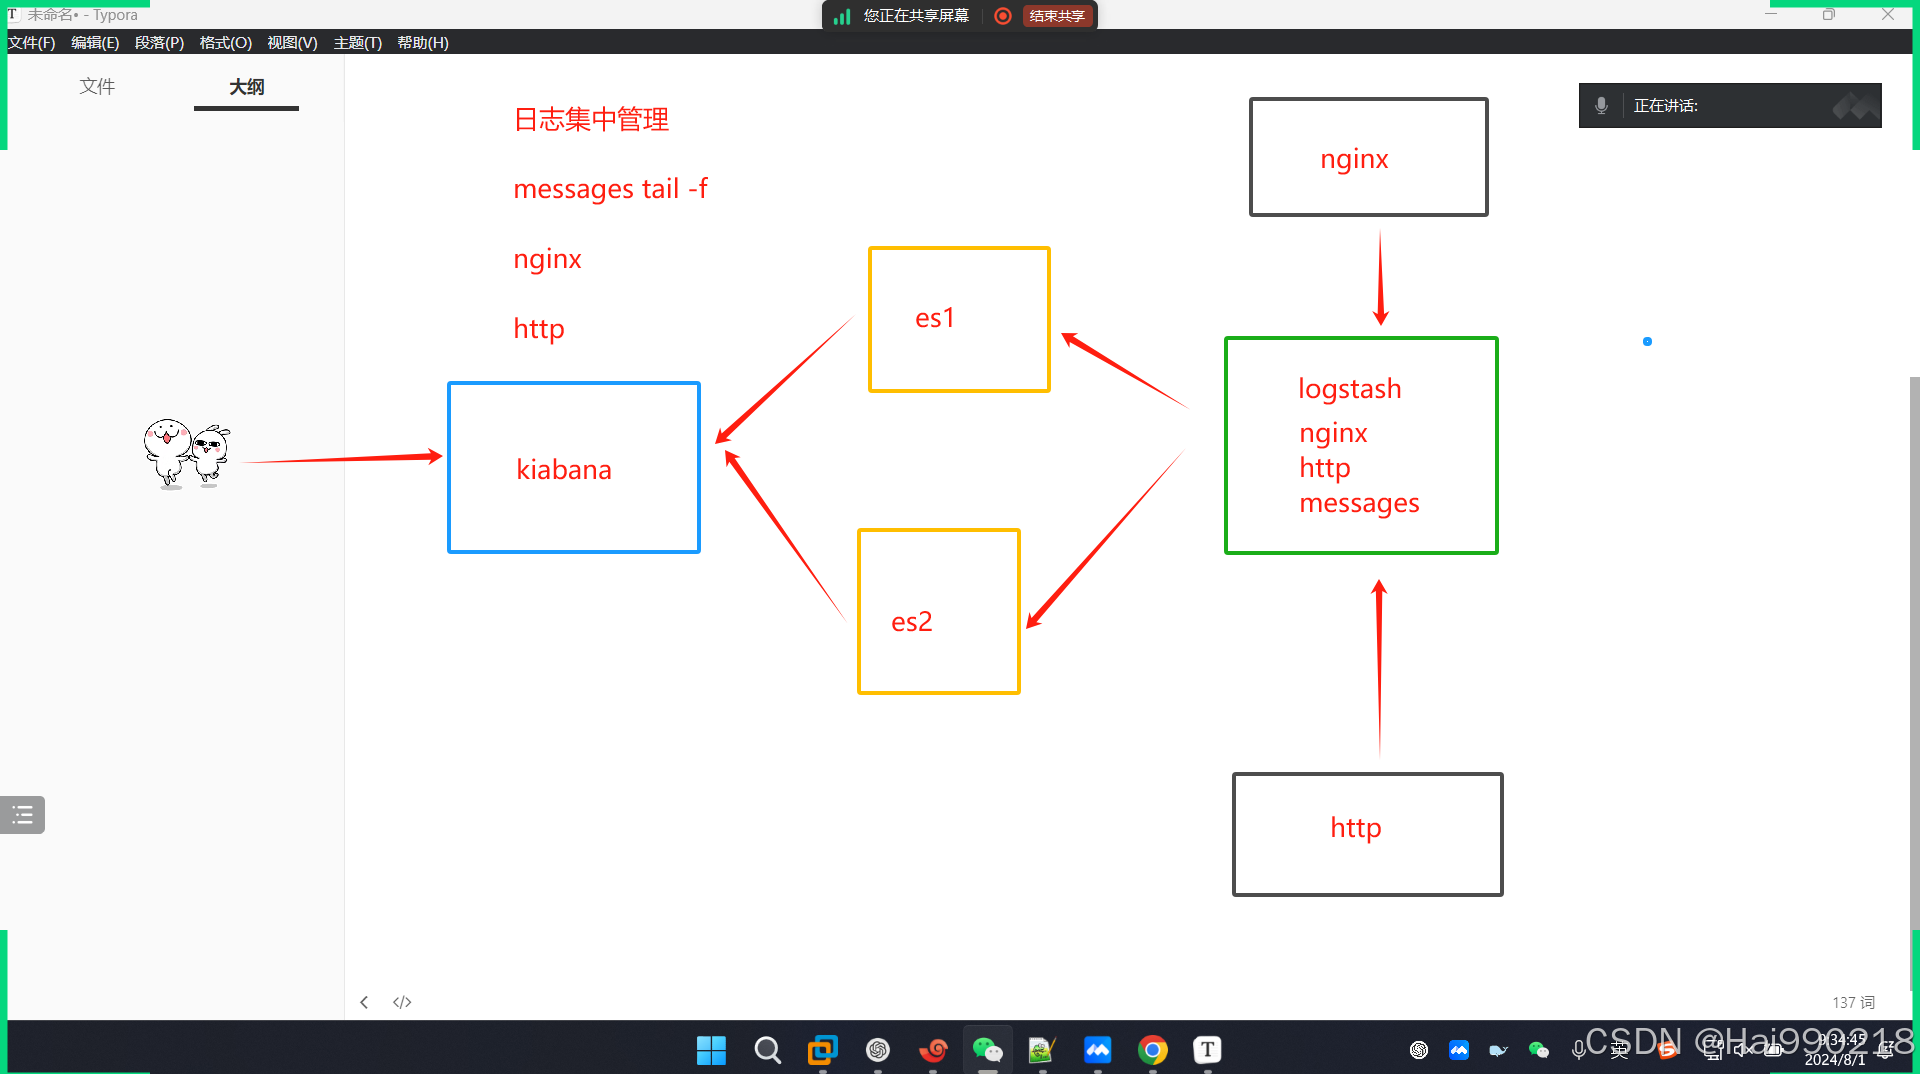
架构
192.168.233.10 ES1
192.168.233.20 ES2
192.168.233.30 logstash+Kibana+nginx/http
步骤
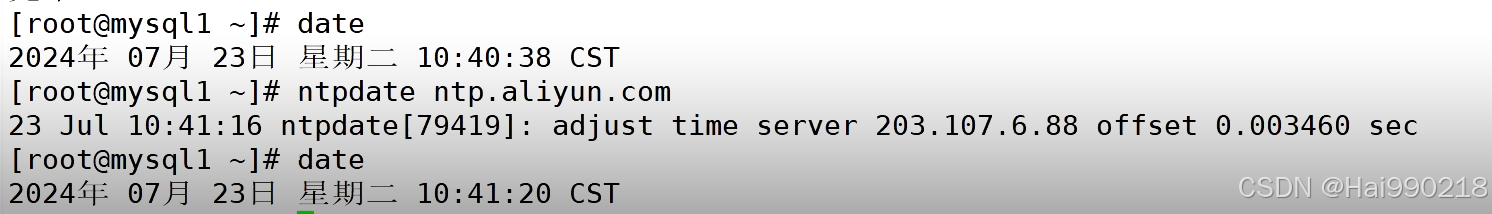
1.安装ntpdate(所有设备都要安装)
yum -y install ntpdate -y
然后查看时间是否一致
安装elasticsearch
2.在ES1和ES2(同步操作)
yum -y install java
安装 elasticsearch-6.7.2
rpm -ivh elasticsearch-6.7.2.rpm
然后配置elasticsearch
vim /etc/elasticsearch/elasticsearch.yml

ES1改为
ES2改为


![]()

然后检查配置文件是否有错
grep -v "^#" /etc/elasticsearch/elasticsearch.yml
systemctl restart elasticsearch.service
netstat -antp | grep 9200
报错日志 tail -f /var/log/elasticsearch/elk-cluster.log
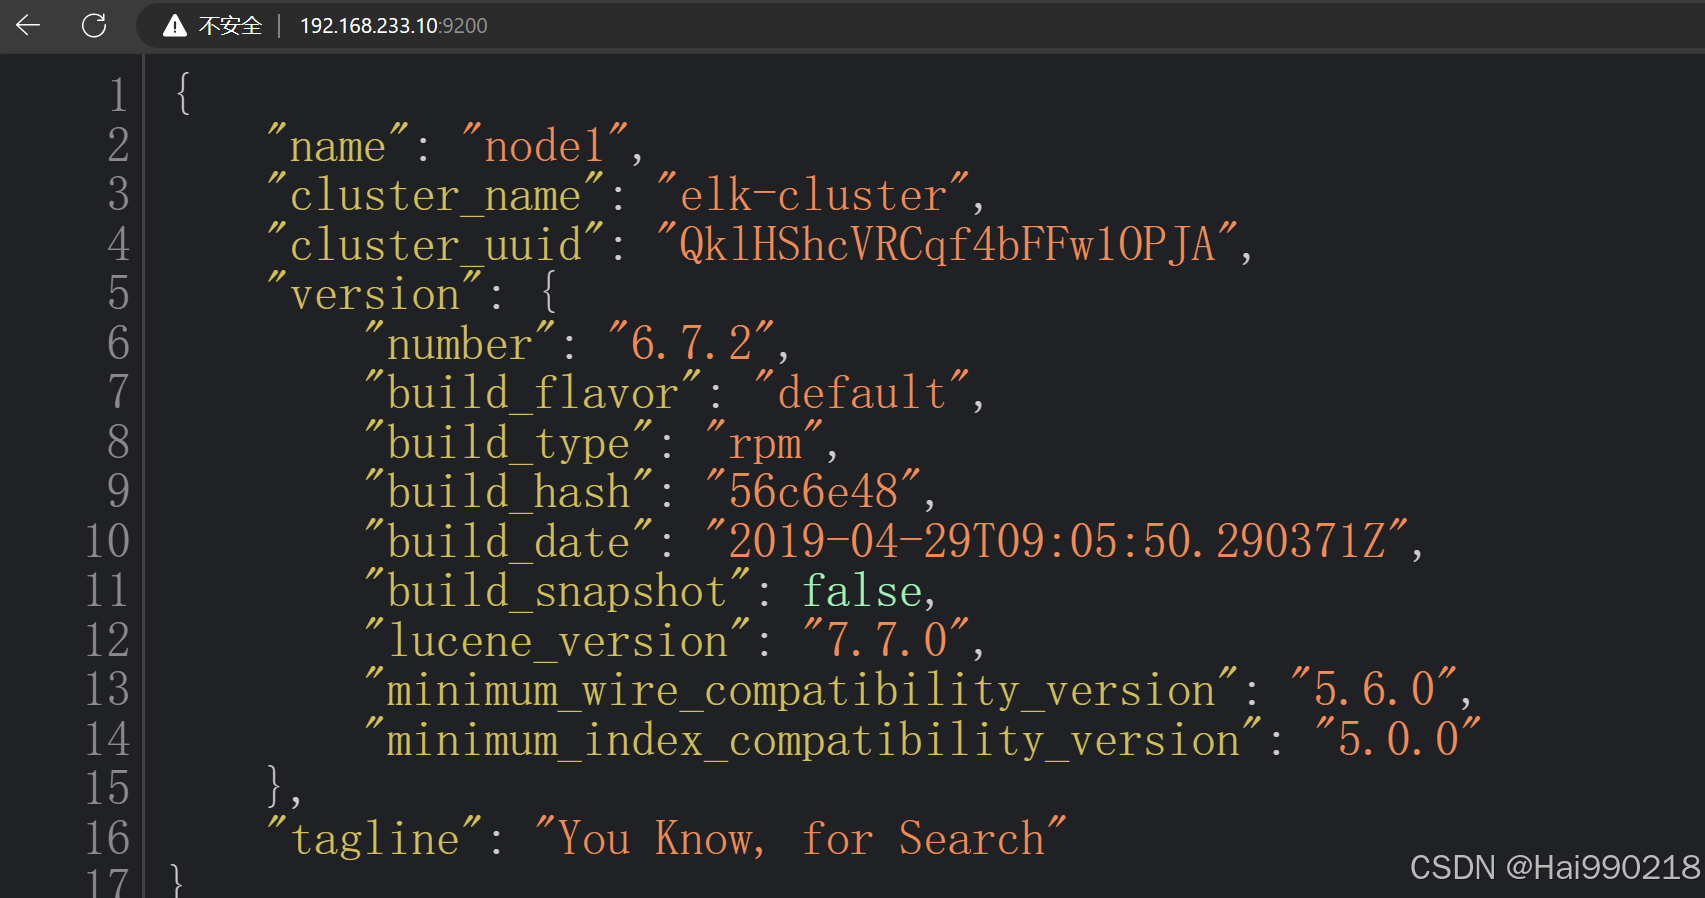
访问浏览器看看是否正常 192.168.233.10:9200
3.两台ES都安装以下三个软件(同步操作)
node:基于谷歌浏览器的运行环境
phantomjs:虚拟浏览器
es-head-master:es的独立可视化工具,可以实现分片索引数据的可视化展示
两台ES同步操作:
把node-v8.2.1.tar、phantomjs-2.1.1-linux-x86_64.tar、elasticsearch-head-master拖进虚拟机
yum -y install gcc gcc-c++ make
tar -xf node-v8.2.1.tar.gz
cd node-v8.2.1/
./configure
make -j 4 && make install
cd /opt/
tar -xf phantomjs-2.1.1-linux-x86_64.tar.bz2
cd /opt/phantomjs-2.1.1-linux-x86_64/
cd bin/
cp phantomjs /usr/local/bin/
cd /opt/
unzip elasticsearch-head-master.zip
cd elasticsearch-head-master/
npm config set registry http://registry.npm.taobao.org/ 指定淘宝镜像
npm install
vim /etc/elasticsearch/elasticsearch.yml
在最后添加

http.cors.enabled: true
http.cors.allow-origin: "*"
然后
systemctl restart elasticsearch.service
netstat -antp | grep 9200
npm run start &
然后访问可视化工具地址 192.168.233.10:9100
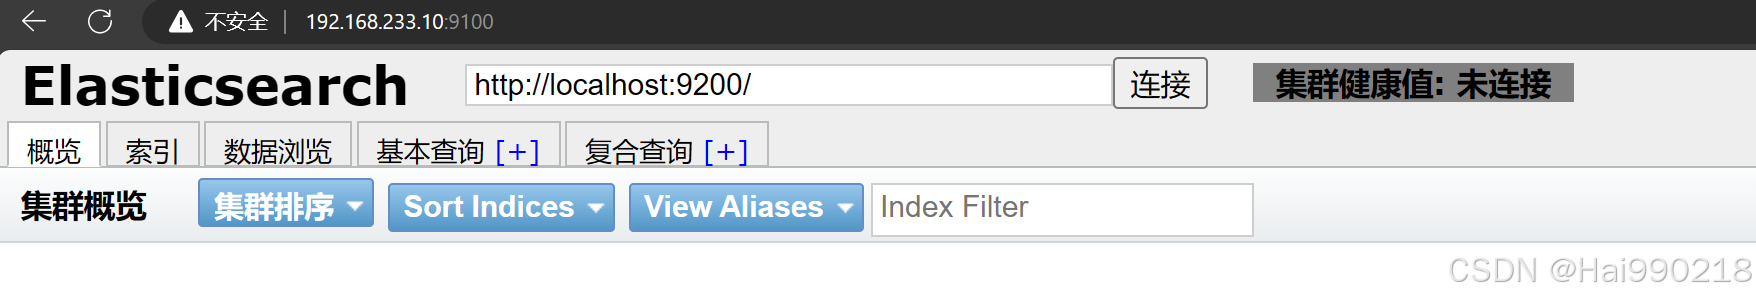
然后把localhost换成IP地址
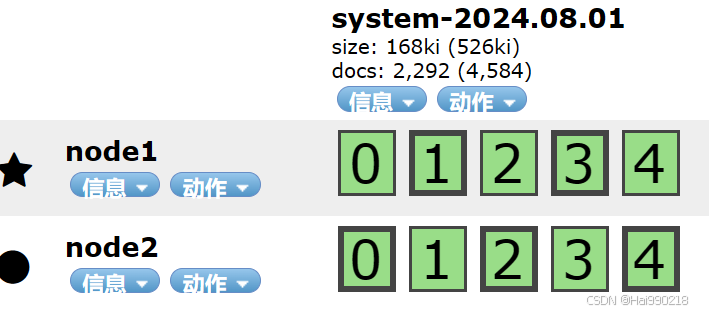
然后在主ES1创建数据(ES也会同步)
curl -X PUT 'localhost:9200/index-demo/test/1?pretty&pretty' -H 'content-Type: application/json' -d '{"user":"zhangsan","mesg":"hello world"}'
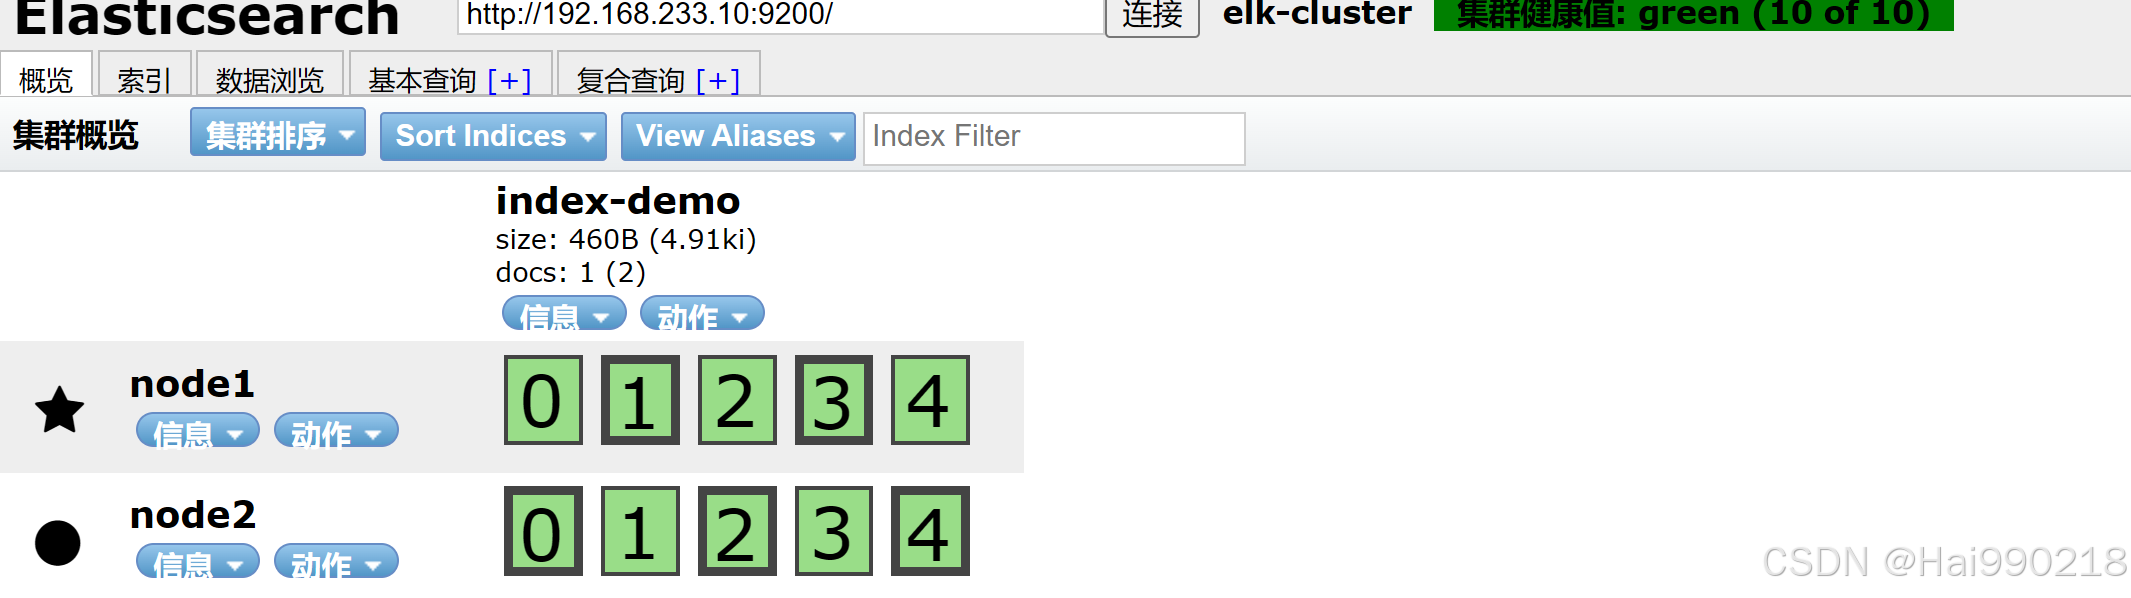
注:每创建一个指名的索引类型都会对数据进行分片
高亮的就是主键,不亮的就是副键
安装logstash
4.在30上操作安装logstash
yum -y install httpd
systemctl restart httpd
yum -y install java
把logstash-6.7.2拖进30虚拟机
rpm -ivh logstash-6.7.2.rpm
systemctl restart logstash.service
ln -s /usr/share/logstash/bin/logstash /usr/local/bin/
#可以指定logstash的工作目录,默认为:/etc/logstash/conf.d
修改 vim /logstash.yml 然后在最后修改为 path.config: /opt/log
5.测试 Logstash 实例
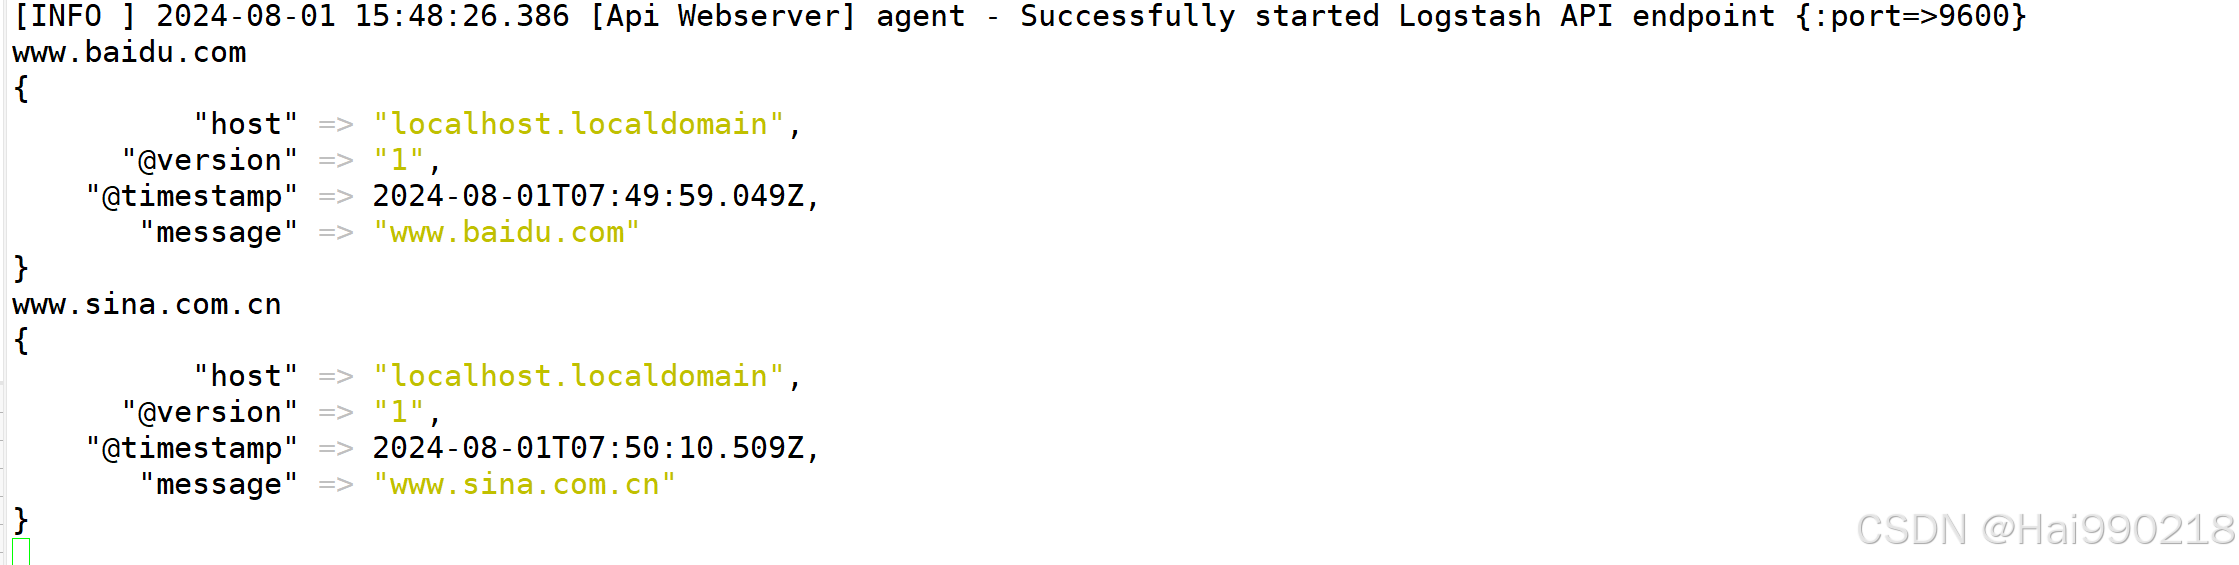
logstash -e 'input { stdin{} } output { stdout{} }'

在这个下面输入www.baidu.com
结果
把数据发送到ES1和ES2
logstash -e 'input { stdin{} } output { elasticsearch { hosts=>["192.168.233.10:9200","192.168.233.20:9200"] } }' --path.data /opt/test1
如果报错
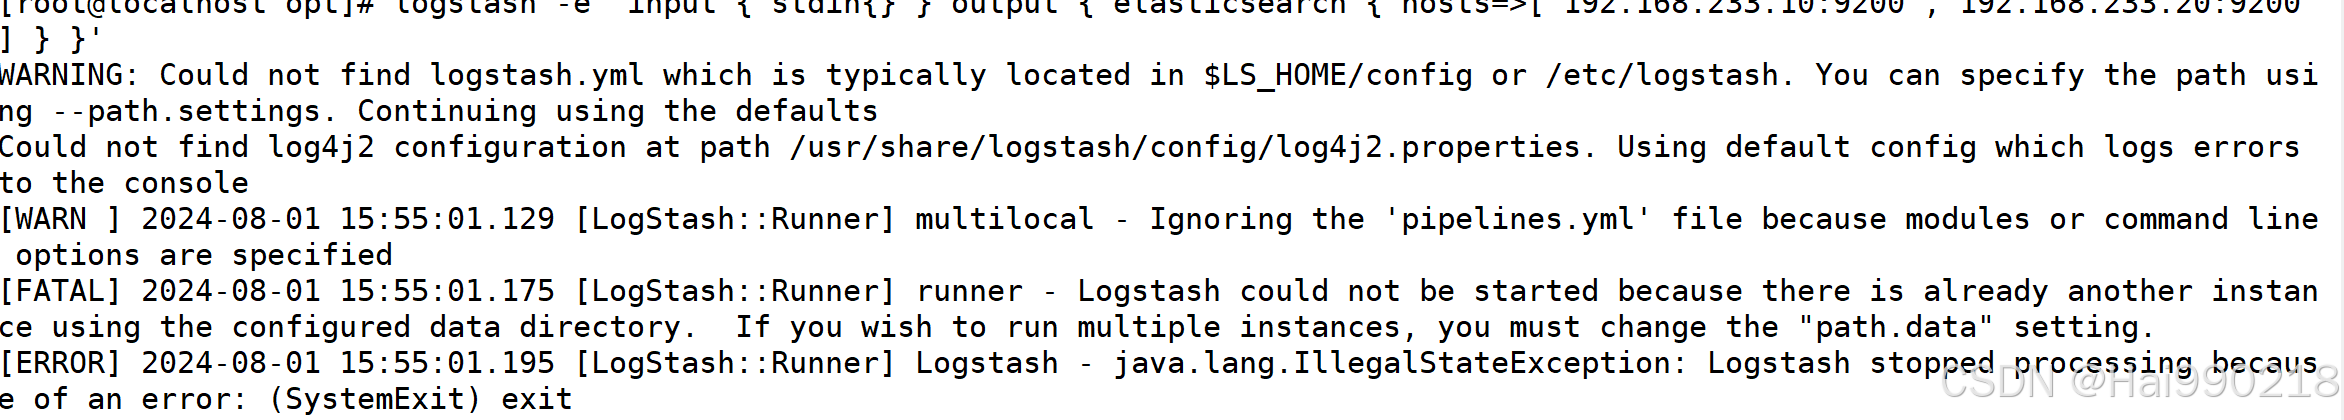
是因为后面没有加--path.data /opt/test1

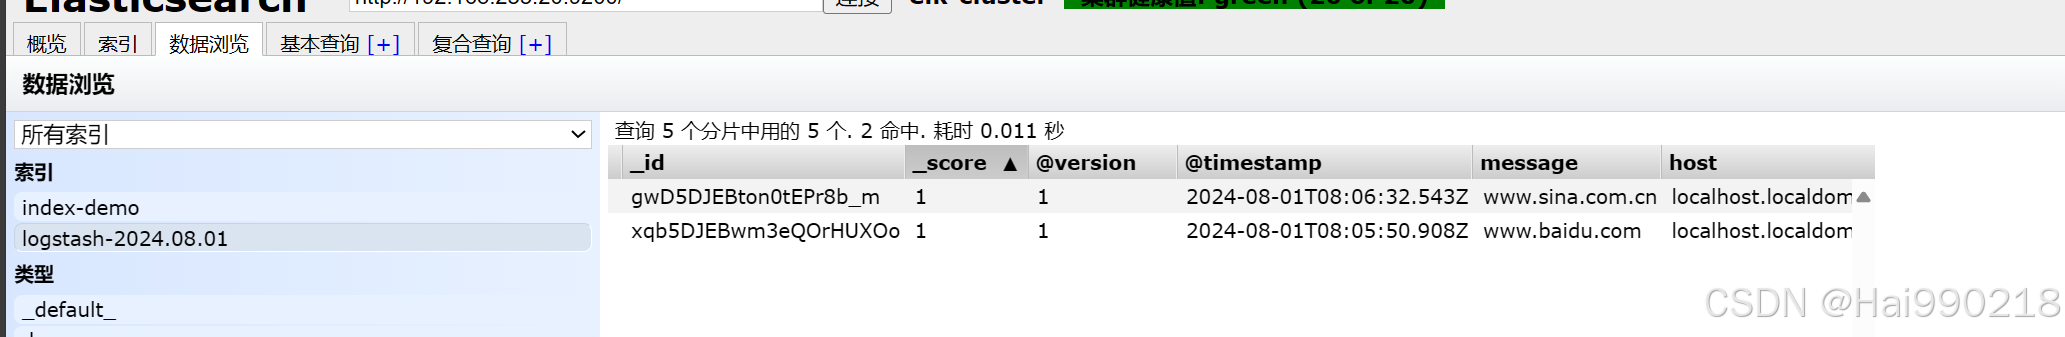
在下面输入网址
www.baidu.com
结果
es的主从和数据模式
node.master: true
es数据库的主从类型 true/false
node.data: true
数据节点,是否保存数据,logstash发送数据,节点是否接收以及保存
ELK索引数据管理
es如何创建,修改,删除数据
通过http的方式创建数据,post方式修改数据
创建数据
curl -X PUT 'localhost:9200/index-demo/test/1?pretty&pretty' -H 'content-Type: application/json' -d '{"user":"zhangsan","mesg":"hello world"}'
对应的就是本地数据量的地址 IP+端口
put就是创建数据
index-demo 创建索引分片的名称
test 数据的名称
1 数据的id字段
?pretty&pretty 参数设定为json格式
-d 数据的具体内容
user":"zhangsan","mesg":"hello world 内容
修改数据
curl -X POST 'localhost:9200/index-demo/test/1/_update?pretty' -H 'Content-Type: application/json' -d '{ "doc": { "user": "zhangsan", "mesg": "hello1 world1" } }'
删除数据
curl -X DELETE 'localhost:9200/index-demo/test/1?pretty&pretty' -H 'content-Type: application/json' -d '{"user":"zhangsan","mesg":"hello1 world1"}'
创建日志收集系统
1.在30上面操作写一个脚本
cd /etc/logstash/conf.d/
vim system.conf (system可以随便写)
input {

    file {

         path =>"/var/log/messages"
         type =>"system"
         start_position =>"beginning"
           }
 }

output {

     elasticsearch {
              hosts=>["192.168.233.10:9200","192.168.233.20:9200"]
              index =>"system-%{+YYYY.MM.dd}"
                }
}
然后赋权 chmod 777 /var/log/messages
启动
logstash -f system.conf --path.data /opt/test2 &
结果
即为创建成功
安装kibana
2.在30上安装kibana
把kibana-6.7.2-x86_64拖入30服务器中
cd /opt/
rpm -ivh kibana-6.7.2-x86_64.rpm
vim /etc/kibana/kibana.yml


然后 touch /var/log/kibana.log
chown kibana.kibana /var/log/kibana.log
systemctl restart kibana.service
systemctl enable kibana.service
结果
然后访问192.168.233.30:5601
然后点击“自己浏览” 上面点击“否”
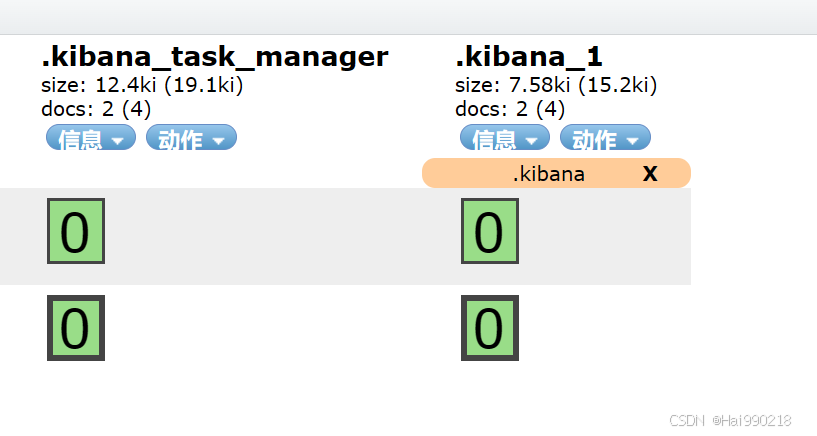
同步数据


httpd日志收集脚本
cd /etc/logstash/conf.d/
vim http.conf
input {

    file {

       path => "/etc/httpd/logs/access_log"
       type => "access"
       start_position => "beginning"
   }

        file {

       path => "/etc/httpd/logs/error_log"
       type => "error"
       start_position => "beginning"
   }

}

output {

       if [type] == "access" {

        elasticsearch {
        hosts => ["192.168.233.10:9200","192.168.233.20:9200"]
        index => "apache_access-%{+YYYY.MM.dd}"
           }

      }

      if [type] == "error" {

        elasticsearch {
        hosts => ["192.168.233.10:9200","192.168.233.20:9200"]
        index => "apache_error-%{+YYYY.MM.dd}"
           }

      }

}
启动
logstash -f http.conf --path.data /opt/test6 &
如果内存满了,可以清理缓存 echo 1 > /proc/sys/vm/drop_caches

注:API接口:是软件内部代码之间通信的接口即代码的连接,是代码之间调用的接口
端口是对外提供访问程序的内容结构
ELKF
ELKF概念
F:filebeat 轻量级的开源日志文件数据收集器。logstah 占用系统资源比较大,属于重量级。有了filebeat可以节省资源,可以通过filebeat和logstash实现远程数据收集
filebeat不能对数据进行标准输出,不能输出为ES格式的数据,所以需要logstash把filebeat数据作标准化处理。
数据流向
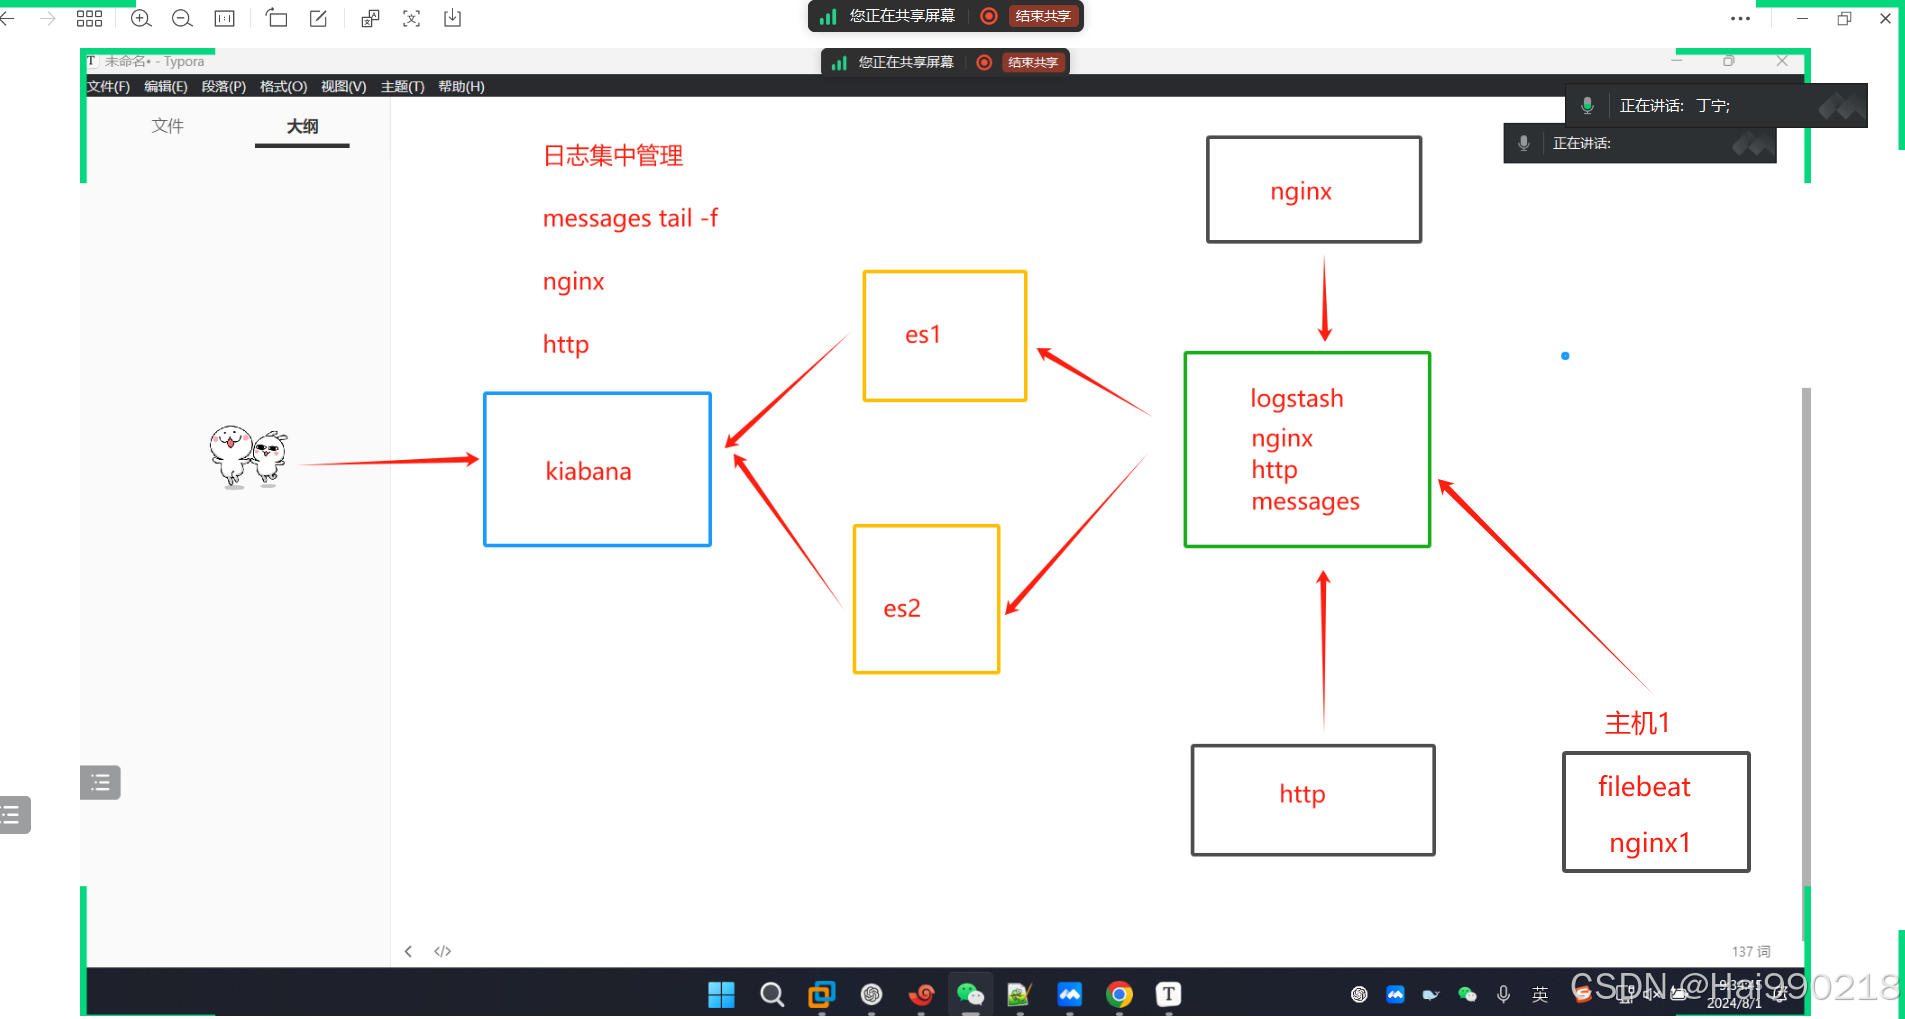
filebeat远程收集nginx日志
filebeat的作用:可以在本机收集日志;也可以远程收集日志;是轻量级的日志收集系统,可以在非java环境运行
logstash是在jvm环境中运行,资源消耗很大,启动一个logstash要消耗500M左右的内存
filebeat只消耗10M左右的内存
操作
cd /opt/
systemctl restart nginx
tar -xf filebeat-6.7.2-linux-x86_64.tar.gz
mv filebeat-6.7.2-linux-x86_64 /usr/local/filebeat
cd /usr/local/filebeat/
cp filebeat.yml filebeat.yml.bak
vim filebeat.yml
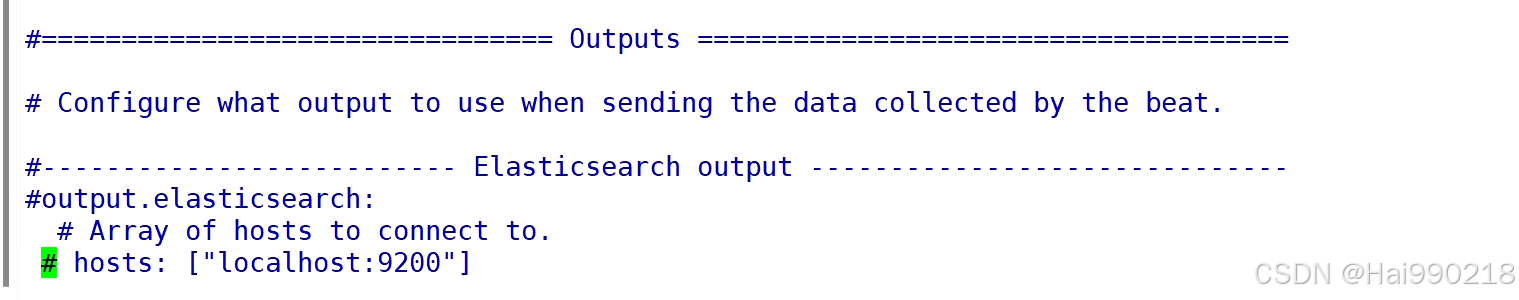
在第一个output取消注释

注:5044是logstash默认的端口,只要是logstash主机上没有被占用的端口都可以使用。必须大于1024
回到logstash服务器
cd /etc/logstash/conf.d/
vim nginx_1.conf
然后回到filebeat
开启收集数据
nohup ./filebeat -e -c filebeat.yml > filebeat.out &
nohup:在系统的后台运行,不会因为终端的关闭导致程序停止运行;可以把运行的日志保存到指定文件
-e:输出到标准输出
-c:指定配置文件
然后回到logstash服务器
logstash -f nginx_1.conf --path.data /opt/test5 &
然后访问192.168.233.30:5601 查看Kibana
filebeat远程收集nginx、httpd、mysqld日志
打开mysql一般日志
vim /etc/my.cnf
添加
general_log=ON
general_log_file=/usr/local/mysql/data/mysql_general.log
systemctl restart mysqld
systemctl restart httpd
修改nginx的端口
vim /usr/local/nginx/conf/nginx.conf

因为httpd的端口也是80,两个端口一样不能同时启动,所以得把nginx的端口修改
systemctl restart nginx
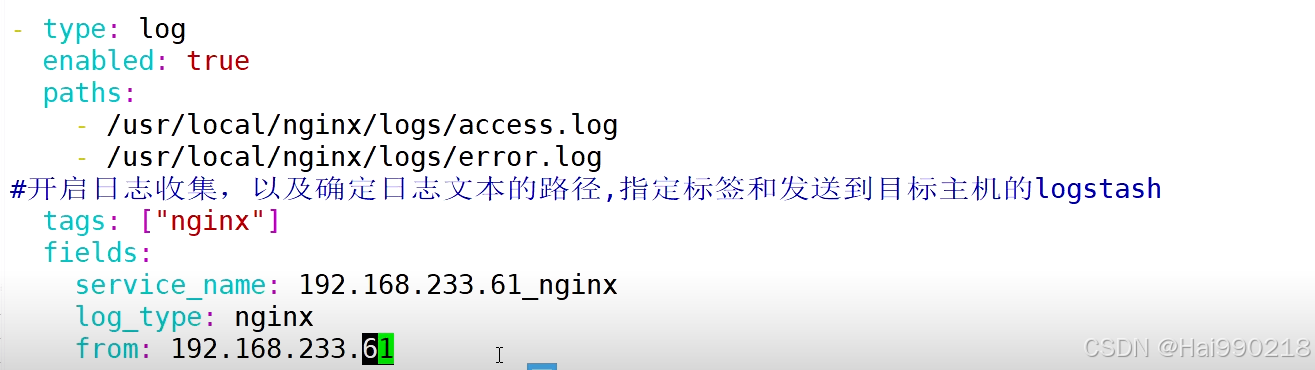
vim filebeat.yml
- type: log
  enabled: true
  paths:
    - /usr/local/nginx/logs/access.log
    - /usr/local/nginx/logs/error.log
  tags: ["nginx"]
  fields:
    service_name: 192.168.233.70_nginx
    log_type: nginx
    from: 192.168.233.70

- type: log
  enabled: true
  paths:
    - /var/log/httpd/access_log
    - /var/log/httpd/error_log
  tags: ["httpd"]
  fields:
    service_name: 192.168.233.70_httpd
    log_type: httpd
    from: 192.168.233.70

- type: log
  enabled: true
  paths:
    - /usr/local/mysql/data/mysql_general.log
  tags: ["mysqld"]
  fields:
    service_name: 192.168.233.70_mysqld
    log_type: mysqld
    from: 192.168.233.70
注:这里不能复制粘贴,容易出错,只能一个个手打
因为我nginx是编译安装所以日志日志位置不一样,httpd是epel源安装的,注意看一下日志位置
在第一个output取消注释
注意:上面hosts有了,下面的就不能一样要修改
然后回到logstash服务器上
cd /etc/logstash/conf.d/
vim mysql_1.conf
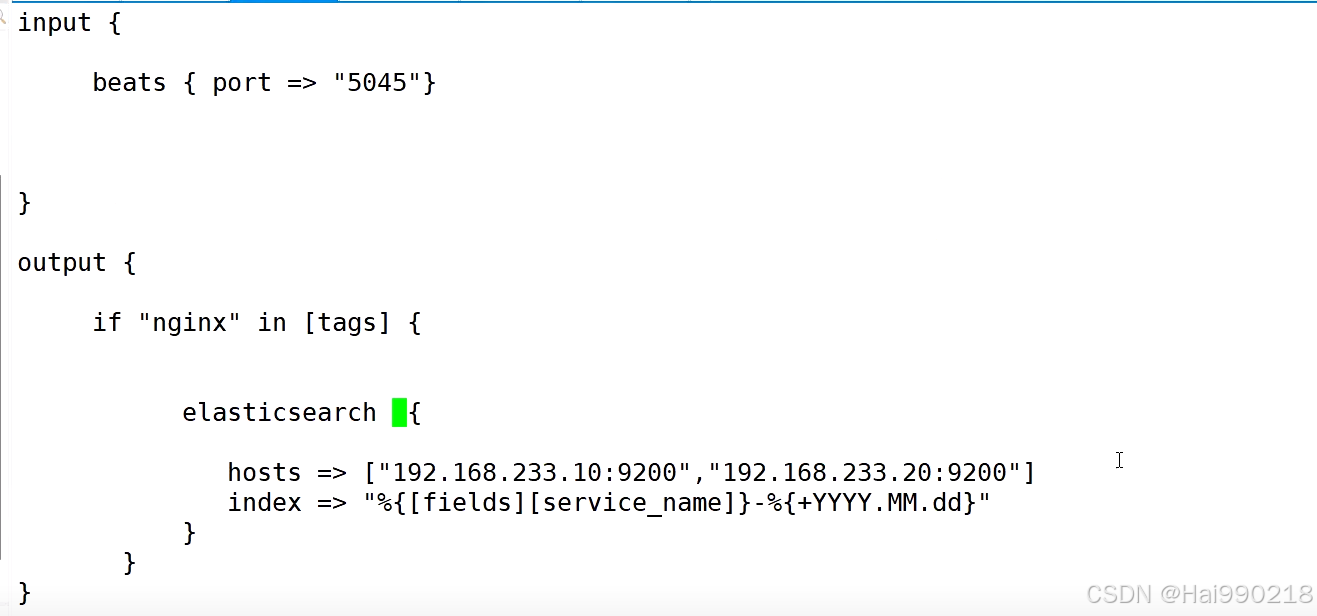
input {

   beats { port => "5045" }
}

output {

   if "nginx" in [tags] {

      elasticsearch {
              hosts=>["192.168.233.10:9200","192.168.233.20:9200"]
              index => "%{[fields][service_name]}-%{+YYYY.MM.dd}"
                }

 }

if "httpd" in [tags] {

      elasticsearch {
              hosts=>["192.168.233.10:9200","192.168.233.20:9200"]
              index => "%{[fields][service_name]}-%{+YYYY.MM.dd}"
                }

 }


if "mysqld" in [tags] {

      elasticsearch {
              hosts=>["192.168.233.10:9200","192.168.233.20:9200"]
              index => "%{[fields][service_name]}-%{+YYYY.MM.dd}"
                }

}
}
然后回到filebeat
开启收集数据
nohup ./filebeat -e -c filebeat.yml > filebeat.out &
然后回到logstash服务器
logstash -f mysql_1.conf --path.data /opt/test5 &
然后访问192.168.233.10:9100
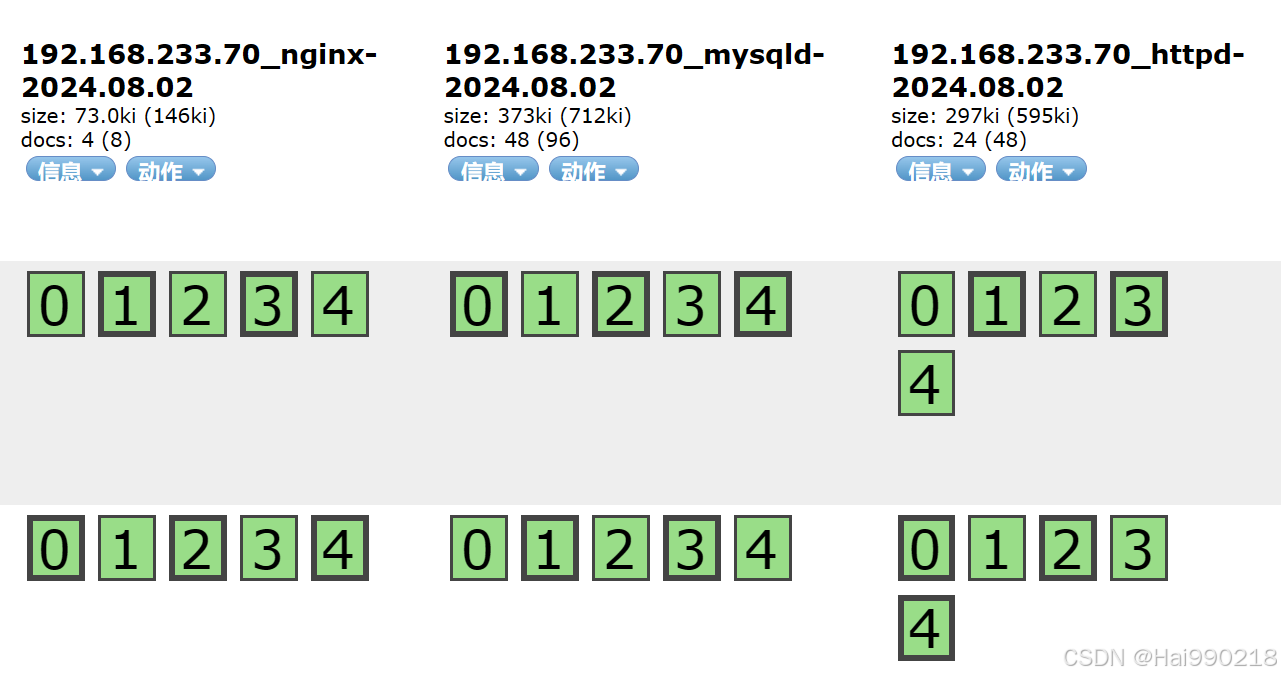
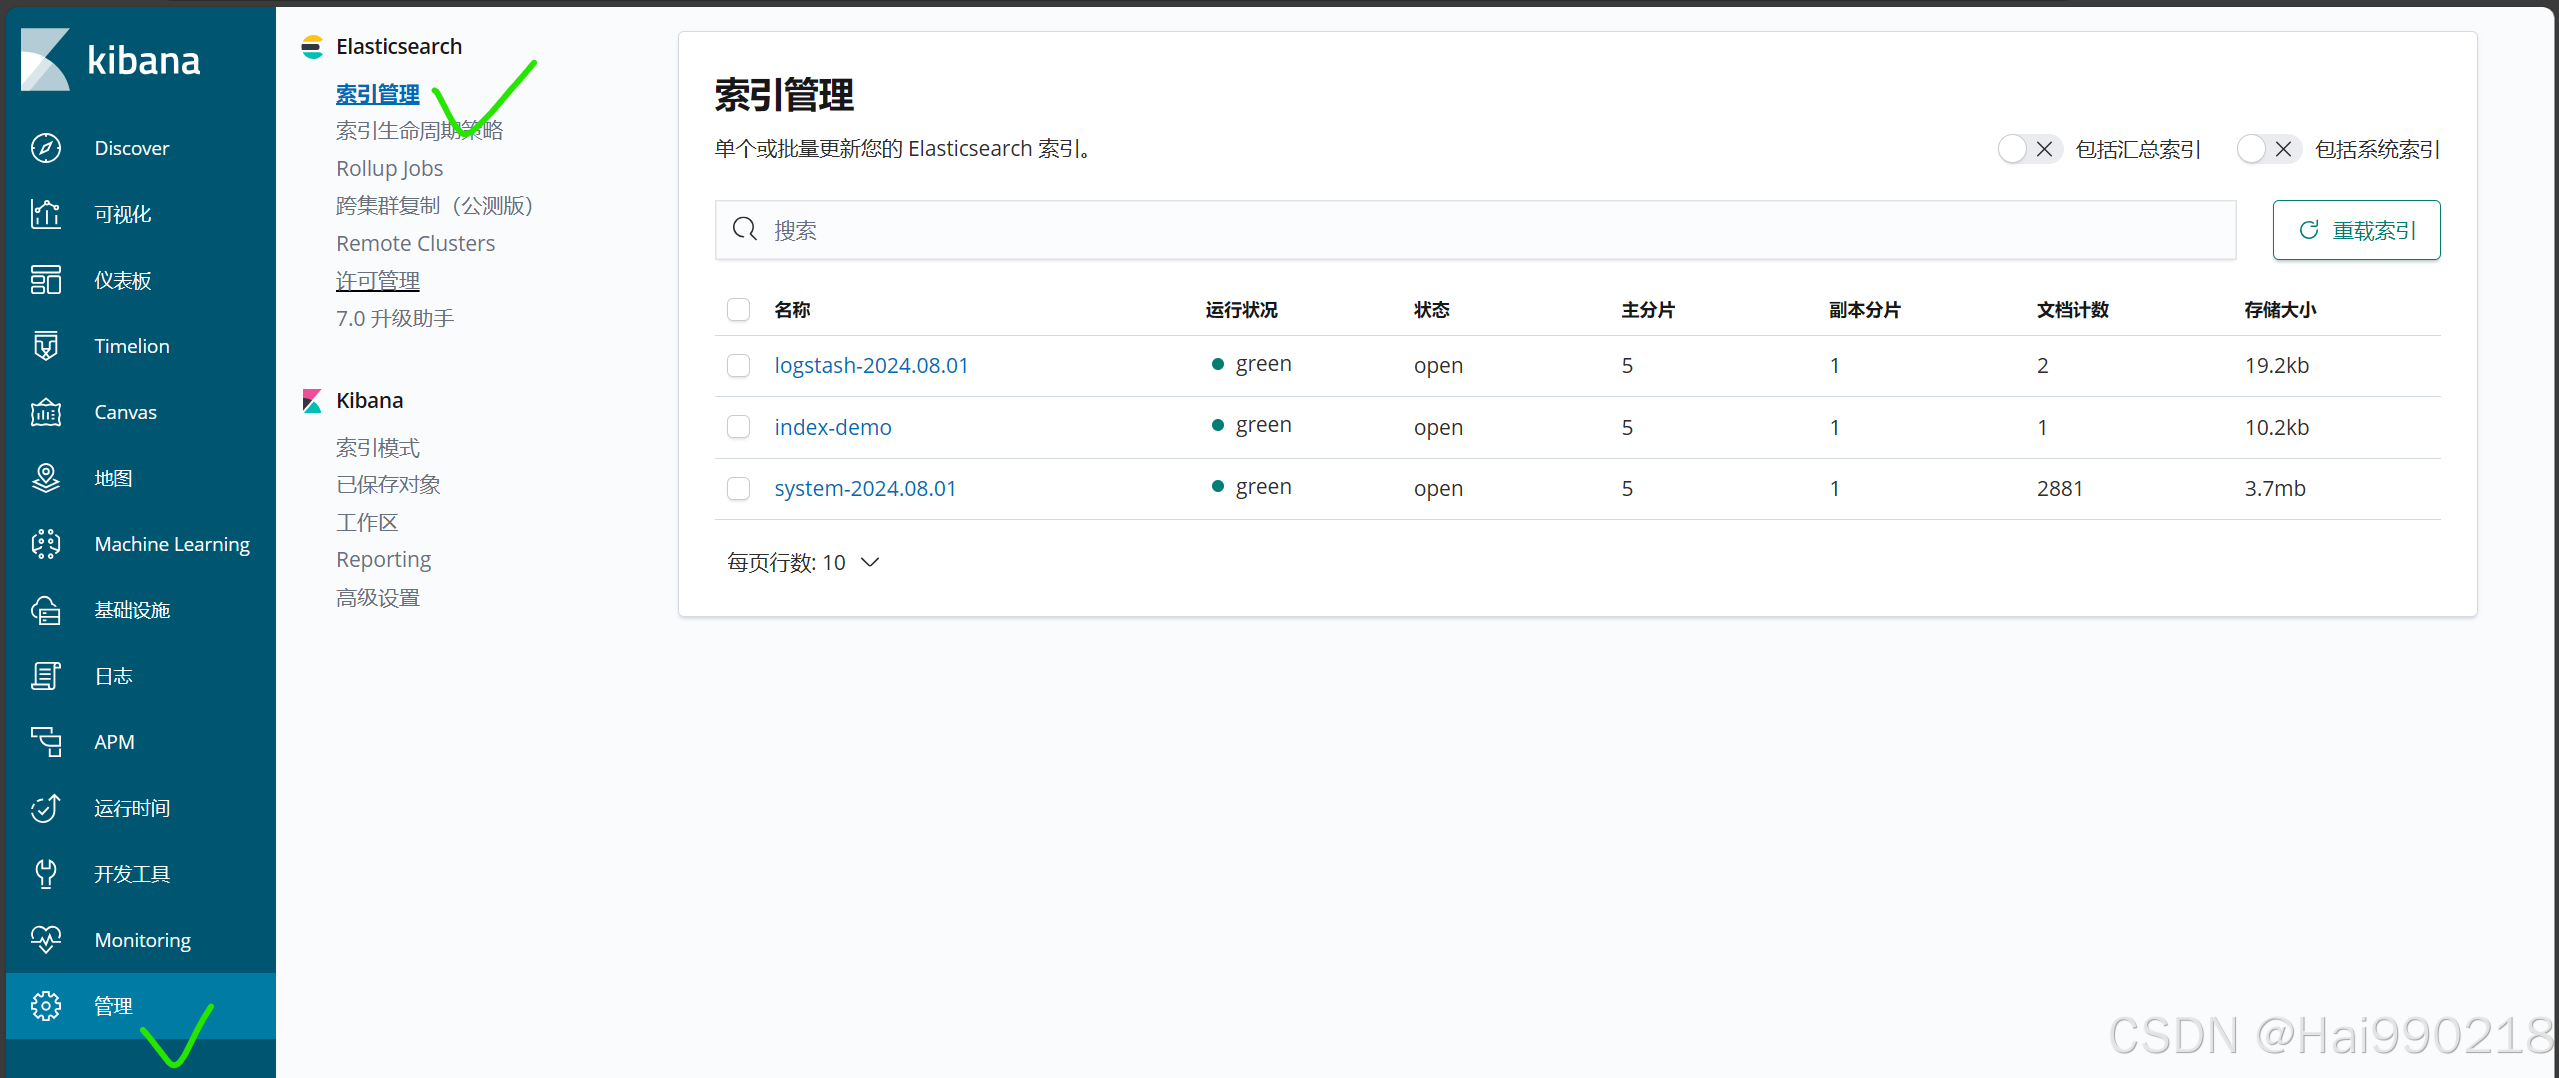
然后访问192.168.233.30:5601 查看Kibana


 1699
1699

 被折叠的 条评论
为什么被折叠?
被折叠的 条评论
为什么被折叠?
 到【灌水乐园】发言


