


 本文介绍了使用Python的Matplotlib库进行数据可视化的基本操作,包括plot、bar、hist、scatter、pie、boxplot和polar图。详细讲解了各种图表的参数设置,如线条样式、颜色、数据范围、密度展示等,并提到了如何创建双轴和应用axes对象进行自定义调整。
import matplotlib.pyplot as plt
基本绘图plot
 plot([x], y, [fmt], data=None, **kwargs)
 plot([x], y, [fmt], [x2], y2, [fmt2], ..., **kwargs)
[fmt] 可以用来设置线条样式和颜色
plt.plot中的data参数可以为一个字典或者DataFrame对象,然后子啊x和y上指定列的名字。
plt.plot('a','b','',data = data1 )
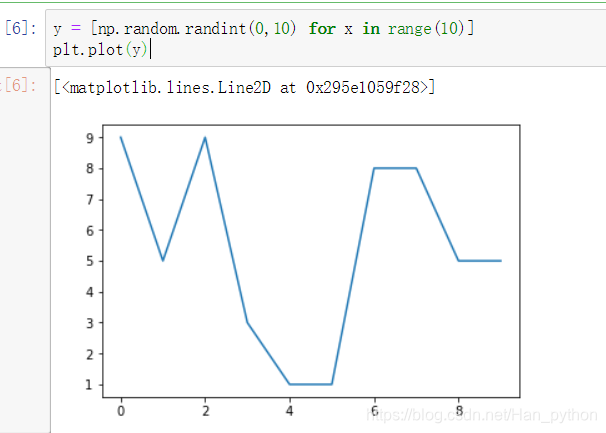
y1 = [np.random.randint(0,10) for x in range(10)]
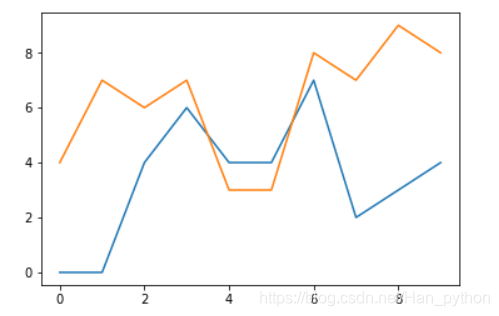
y2 = [np.random.randint(0,10) for x in range(10)]
lines = plt.plot(range(10),y1,range(10),y2)
可以取出每条线单独设置样式
line1 = lines[0]
line1.set_color('r')
plt.figure(figsize = (15,5))
plt.xticks()
plt.xlabel()
plt.title()
font.set_size()
plt.show()
plt.grid()
marker
plt.anotate()
from matplotlib import font_manager
创建一个字体对象matplotlib.font_manager.FontProperties,指定fname参数(路径)
plt.style.use()
绘制多个图
子图都是Axes对象
subplot(rows,cols,x)
plt.subplot(221)
plt.plot(x1,y1)
plt.plot(x2,y2)
plt.subplot(222)
plt.plot(x2,y2)
或者 fig,axs = plt.subplots(rows,cols,*args,**kwargs)
figure,axes = plt.subplots(2,2)
axes[0,0].plot(x1,y1)
axes[0,1].plot(x2,y2)
条形图bar
bar(x, height, width, bottom, *, align='center', **kwargs)
movies = {'流浪地球':45.5,
            '飞驰人生':12}
x = list(movies.keys())
y = list(movies.values())
plt.bar(x,y)
#方法二
movie_df = pd.DataFrame(data = {'names':list(movies.keys()),'tickets':list(movies.values())})
plt.bar('names','tickets',data = movie_df)
横向条形图 barh
直方图hist
hist(x, bins=None, range=None, density=None, weights=None, cumulative=False, ..., **kwargs)
- range设置数据范围
- density设置为频率展示
- cumulative设置为累加
plt.xticks(bins,bins) #第一个bins代表坐标轴,第二个代表标签内容
edgecolor = 'K'
这个函数会返回三个值
- n : array or list of arrays 区间值的个数
- bins : array 区间的值
- patches : list or list of lists 每根条的对象
散点图scatter
scatter(x, y, s=None, c=None, marker=None, edgecolors=None,data=None, **kwargs)
- s代表大小
- c代表颜色
饼图
pie(x, explode=None, labels=None, colors=None, autopct=None, data=None)
- x占比大小
- labels分块名称
- autopct设置比例文字展示方式
箱线图boxplot
上限值
上四分位数Q3+1.5*(Q3-Q1)
中位数
下四分位数Q1
下限值Q1-1.5*(Q3-Q1)
boxplot(x, notch=None,vert=None, whis=None, meanline=None, showmeans=None, labels=None)
- notch 置信区间
- whis上下限系数
- vert垂直
雷达图 polar
plt.polar和plt.plot参数类似,只不过x轴的坐标点对应的为弧度
polar(theta, r, **kwargs)
- theta弧度
- r值
或者使用子图创建
axes = plt.subplot(111,projection = 'polar')
axes.plot(theta,values)
axes.fill(theta,values)
- Figure 画板
- Axes 每个图都是axes对象
- Axis x轴、y轴对象
- Tick x轴和y轴的刻度对象,每个刻度都是一个tick对象
- Ticklabel 每个刻度上要显示文字,文字就在ticklabel上
- Axislabel x轴和y轴文字显示
- Legend 图例
- Title 标题
- Line2D 线条对象
- Reactangle 矩形对象
- Marker 标记点
- Artist 所有的对象都是它的子类
Axes对象:
fig = plt.figure()
ax = fig.add_subplot(221)
ax1.plot(np.random.rand(10))
可以通过figure.gca以及figure.sca来设置和获取当前的axes对象
绘制所有图形都是通过axes来实现的,plt.plot只是为了使用方便进行的封装
可以通过set_xlim()和set_ylim()来设置x和y轴的最大和最小值
可以设置双y轴。ax.twinx()来克隆新的对象


 2005
2005

 被折叠的 条评论
为什么被折叠?
被折叠的 条评论
为什么被折叠?
 到【灌水乐园】发言


