


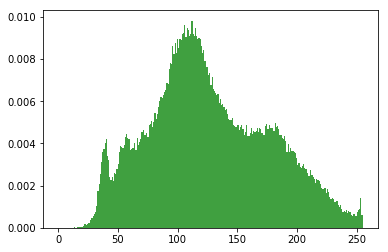
灰度图直方图
调用matplotlib.pyplot库进行绘图,其中的hist函数可直接绘制直方图。调用方式:
n, bins, patches = plt.hist(arr, bins=50, normed=1, facecolor='green', alpha=0.75)
hist的参数非常多,但常用的就这五个,只有第一个是必须的,后面四个可选
arr: 需要计算直方图的一维数组
bins: 直方图的柱数,可选项,默认为10
normed: 是否将得到的直方图向量归一化。默认为0
facecolor: 直方图颜色
alpha: 透明度
返回值 :
n: 直方图向量,是否归一化由参数设定
bins: 返回各个bin的区间范围
patches: 返回每个bin里面包含的数据,是一个list
示例
import matplotlib.pyplot as plt
from PIL import Image
import numpy as np
img = np.array(Image.open('/home/keysen/caffe/examples/images/cat.jpg').convert('L'))

plt.figure('cat')
arr = img.flatten()
n, bins, patches = plt.hist(arr, bins=256, normed=1, facecolor='green', alpha=0.75)
plt.show()
output
上面用到的flatten函数在这里单独介绍,相关的函数是reshape函数。
# 一维数组
arr = np.arange(15)
print arr
output
[ 0 1 2 3 4 5 6 7 8 9 10 11 12 13 14]
如果我们要把这个一维数组,变成一个3*5二维矩阵,使用reshape来实现
re_arr = arr.reshape(3,5)
print(re_arr)
output
[[ 0 1 2 3 4]
[ 5 6 7 8 9]
[10 11 12 13 14]]
现在如果我们返过来,知道一个二维矩阵,要变成一个一维数组,就不能用reshape了,只能用flatten. 我们来看两者的区别
a1=re_arr.reshape(1,-1)  #-1表示为任意,让系统自动计算
print(a1)
a2=re_arr.flatten()
print(a2)
output
[[ 0 1 2 3 4 5 6 7 8 9 10 11 12 13 14]]
[ 0 1 2 3 4 5 6 7 8 9 10 11 12 13 14]
可以看出,用reshape进行变换,实际上变换后还是二维数组,两个方括号,因此只能用flatten.
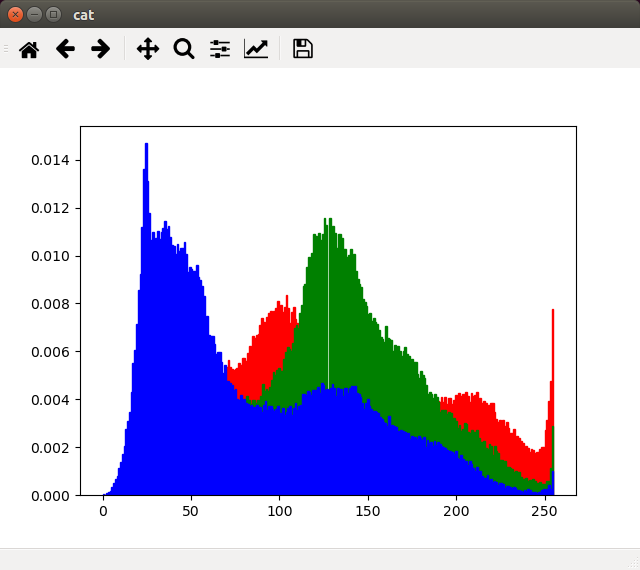
彩色图片直方图
实际上是和灰度直方图一样的,只是分别画出三通道的直方图,然后叠加在一起
from PIL import Image
import numpy as np
import matplotlib.pyplot as plt
src= Image.open('/home/keysen/caffe/examples/images/cat.jpg')
r,g,b=src.split()

plt.figure("cat")
ar=np.array(r).flatten()
plt.hist(ar, bins=256, normed=1,facecolor='r',edgecolor='r',hold=1)
ag=np.array(g).flatten()
plt.hist(ag, bins=256, normed=1, facecolor='g',edgecolor='g',hold=1)
ab=np.array(b).flatten()
plt.hist(ab, bins=256, normed=1, facecolor='b',edgecolor='b')
plt.show()
output
有兴趣可以参考matplotlib的官方文档:http://matplotlib.org/api/pyplot_summary.html


 2251
2251

 被折叠的 条评论
为什么被折叠?
被折叠的 条评论
为什么被折叠?
 到【灌水乐园】发言


