


一、prometheus安装
# 1.拉镜像
docker pull prom/prometheus:v2.43.0
# 2.创建配置文件,prometheus官方不支持nacos,第三方支持不好,问题较多,暂时考虑手工配置job
mkdir /opt/prometheus/data
cd /opt/prometheus/
vi prometheus.yml 【见附件:prometheus.yml】
# my global config
global:
  scrape_interval: 15s
  evaluation_interval: 15s

alerting:
  alertmanagers:
    - static_configs:
        - targets:
rule_files:
scrape_configs:
  - job_name: "prometheus"
    static_configs:
      - targets: ["localhost:9090"]
# 配置
  - job_name: 'xxxx1-service'
    scrape_interval: 10s  # 60s
    metrics_path: '/prometheus'
    static_configs:
    - targets: ["192.168.6.45:21330"]

  - job_name: 'xxxx2-service'
    scrape_interval: 10s  # 60s
    metrics_path: '/prometheus'
    static_configs:
    - targets: ["192.168.6.45:21330"]
# 3.启动prometheus
docker run --name prometheus -d -p 9090:9090 -v /opt/prometheus/prometheus.yml:/etc/prometheus/prometheus.yml -v /opt/prometheus:/prometheus --user=root prom/prometheus:v2.43.0
# 4.验证 有ui
浏览器访问:http://ip:9090/graph【例如:http://192.168.6.45:9090/graph】

二、Grafana安装
# 1.拉镜像
docker pull grafana/grafana-enterprise:8.5.22
# 2.启动Grafana
docker run -d --name=grafana -p 3000:3000 grafana/grafana-enterprise:8.5.22
# 3.验证 有ui
浏览器访问:http://ip:3030【例如:http://192.168.6.45:3030】

# 4.配置数据源
左侧【设置】【Data sources】【Add Data sources】
选择 prometheus
url 填写 prometheus对应的url【例如:http://192.168.6.45:9090】
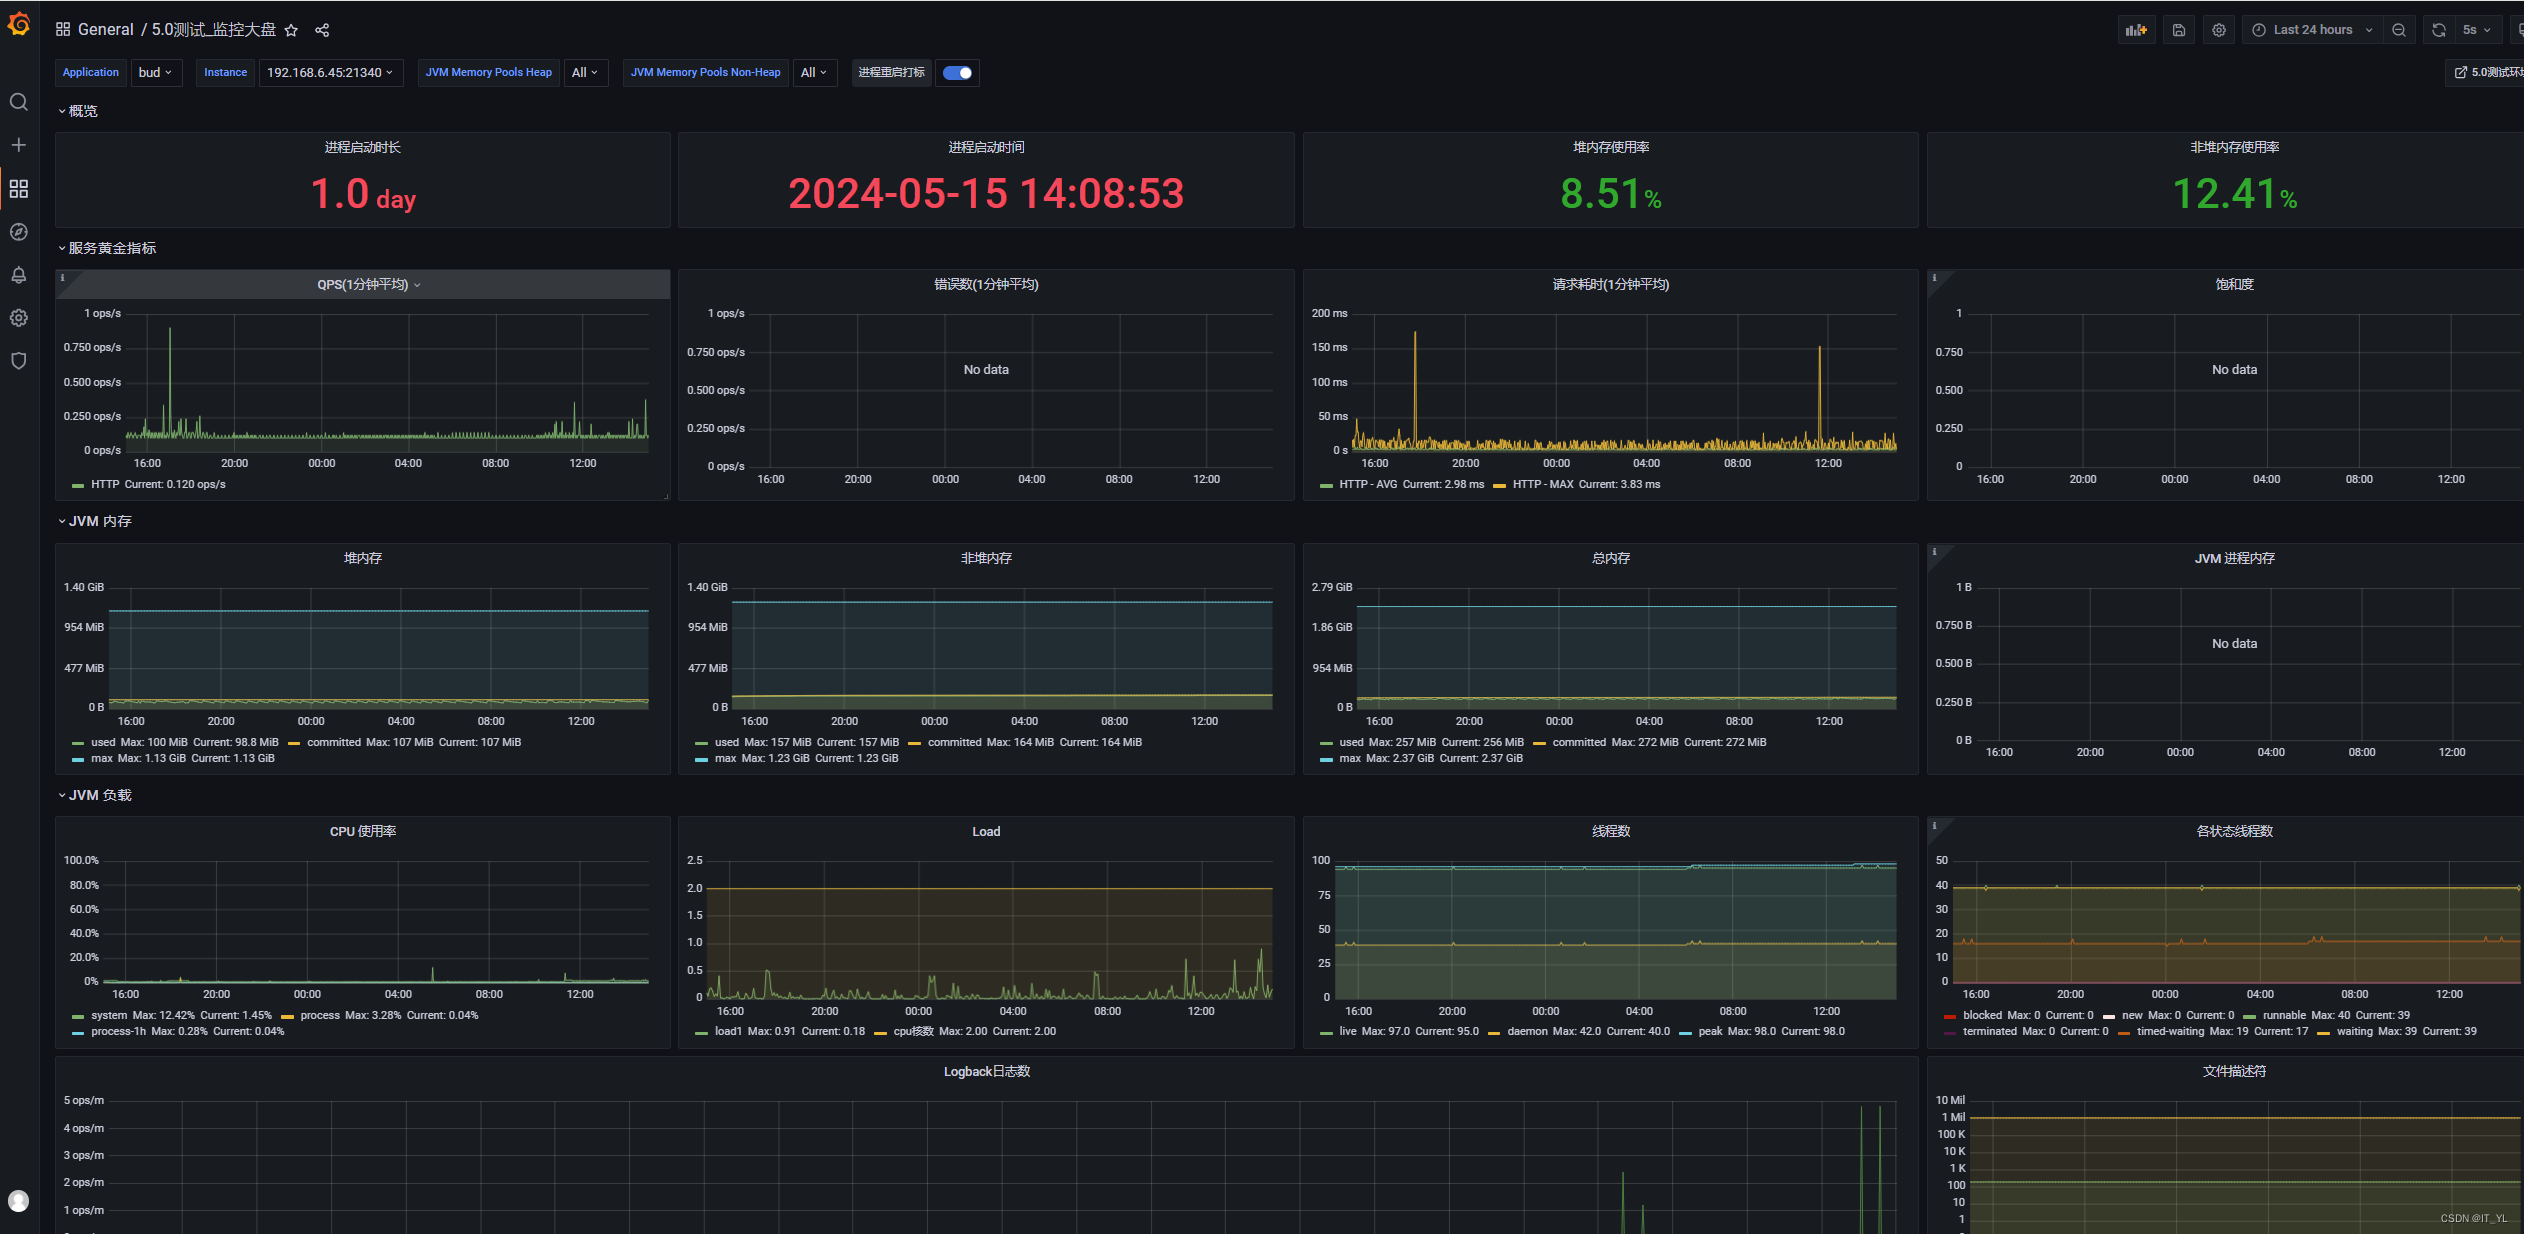
# 5.导入指标模板
左侧【+】【create】【import】【upload json file】
【见附件:5.0测试_监控大盘-1715837259973.json】【搜id:12856】
三、Spring boot 项目配置
# 1.maven 增加依赖
<dependency>
<groupId>org.springframework.boot</groupId>
<artifactId>spring-boot-starter-actuator</artifactId>
</dependency>
<dependency>
<groupId>io.micrometer</groupId>
<artifactId>micrometer-registry-prometheus</artifactId>
</dependency>
# 2.配置文件中增加配置
management.endpoints.web.exposure.include = env,health,prometheus
management.endpoint.shutdown.enabled=false
management.endpoint.metrics.enabled=true
management.metrics.tags.application=${spring.application.name}
management.metrics.export.prometheus.enabled=true
重启服务


 51万+
51万+


 被折叠的 条评论
为什么被折叠?
被折叠的 条评论
为什么被折叠?
 到【灌水乐园】发言


