


效果图
有灰色背景
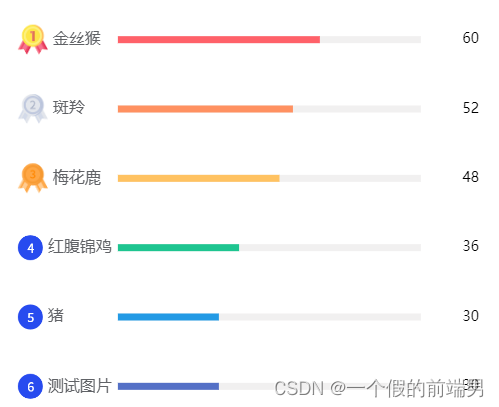
代码说明 下图为 全部代码 项目中封装有echarts的hooks 大家可以直接使用官方的引入
简单说明 几个重要的字段:
grid:根据页面设置图表距离盒子的那位置
axisLabel:字段中的margin: 竖坐标距离图表的具体  根据自己的图表来调整
图片和字体
图片的使用是用背景图引入  因项目中使用的是vue3+vite+js 所以用import.meta.url来完成 vue2可以用require
a1: {
		width: 30,  // 图片宽度
		height: 30, // 图片高度
		align: "center",
		backgroundColor: {
			image: new URL("../../../../assets/images/firstC.png", import.meta.url).href  // 背景图
		}
	},
textStyle: {  // 字体颜色和字号
	color: "#606266",
	fontSize: 16
},
formatter: function (params) {  // 显示的格式
	let index = datas.map(item => item.name).indexOf(params);
	index = index + 1;
	return "{a" + index + "|}" + " " + params;
}
<template>
	<div ref="echartsRef" class="pie-box"></div>
</template>

<script setup lang="ts" name="pieChart">
import { ref, onMounted } from "vue";
import * as echarts from "echarts";
import { useEcharts } from "@/hooks/useEcharts";
const echartsRef = ref<HTMLElement>();
onMounted(() => {
	const colorList = ["rgb(255, 97, 105)", "rgb(255, 145, 97)", "rgb(255, 194, 97)", "rgb(30, 197, 144)", "rgb(35, 154, 229)"];
	let datas = [
		{
			value: 60,
			name: "金丝猴"
		},
		{
			value: 52,
			name: "斑羚"
		},
		{
			value: 48,
			name: "梅花鹿"
		},
		{
			value: 36,
			name: "红腹锦鸡"
		},
		{
			value: 30,
			name: "猪"
		},
		{
			value: 30,
			name: "测试图片"
		}
	];
	// 计算出最大值 并使它*1.5 用于渲染 灰色柱状图
	let maxArr = new Array(datas.length).fill(datas[0].value * 1.5);
	let myChart: echarts.ECharts = echarts.init(echartsRef.value as HTMLElement);
	let option: echarts.EChartsOption = {
		tooltip: {
			show: true
		},
		legend: {
			show: false
		},
		grid: {
			bottom: "0",
			left: "22%"
		},
		xAxis: {
			show: false,
			type: "value"
		},
		yAxis: [
			{
				type: "category",
				inverse: true,
				axisLine: {
					show: false
				},
				axisTick: {
					show: false
				},
				axisPointer: {
					label: {
						show: true,
						margin: 30
					}
				},
				data: datas.map(item => item.name),
				axisLabel: {
					margin: 100,
					fontSize: 12,
					align: "left",
					color: "#fff",
					rich: {
						// a: {
						// 	padding: [0, 0, 50, 10]

						// },
						a1: {
							width: 30,
							height: 30,
							align: "center",
							backgroundColor: {
								image: new URL("../../../../assets/images/firstC.png", import.meta.url).href
							}
						},
						a2: {
							backgroundColor: {
								image: new URL("../../../../assets/images/SecondC.png", import.meta.url).href
							},
							width: 30,
							height: 30,
							align: "center"
						},
						a3: {
							backgroundColor: {
								image: new URL("../../../../assets/images/thridC.png", import.meta.url).href
							},
							width: 30,
							height: 30,
							align: "center"
						},
						a4: {
							backgroundColor: {
								image: new URL("../../../../assets/images/blueFour.png", import.meta.url).href
							},
							width: 25,
							height: 25,
							align: "center"
						},
						a5: {
							backgroundColor: {
								image: new URL("../../../../assets/images/blueFive.png", import.meta.url).href
							},
							width: 25,
							height: 25,
							align: "center"
						},
						a6: {
							backgroundColor: {
								image: new URL("../../../../assets/images/blueSix.png", import.meta.url).href
							},
							width: 25,
							height: 25,
							align: "center"
						}
					},
					textStyle: {
						color: "#606266",
						fontSize: 16
					},
					// formatter: "{a1|}  {value}"
					formatter: function (params) {
						let index = datas.map(item => item.name).indexOf(params);
						index = index + 1;
						return "{a" + index + "|}" + " " + params;
					}
				}
			},
			{
				type: "category",
				inverse: true,
				axisTick: "none",
				axisLine: "none",
				axisLabel: {
					show: true,
					fontSize: 14,
					// color: "#aae9ff",
					// inside: true,
					formatter: function (value, index) {
						return datas[index].value;
					},
					rich: {
						a: {
							padding: [0, 0, 0, 0]
						}
					}
				},
				data: datas.map(item => item.value)
			}
		],
		series: [
			{
				z: 2,
				name: "数量",
				type: "bar",
				barWidth: 7,
				zlevel: 1,
				data: datas.map((item, i) => {
					return {
						value: item.value,
						itemStyle: {
							color: colorList[i]
						}
					};
				})
			},
			 {  // 灰色的柱形图
			/	name: "背景",
			 	type: "bar",
			 	barWidth: 7,
			 	barGap: "-100%",
			 	itemStyle: {
				color: "rgba(118, 111, 111, 0.1)"
		 	},
		 		tooltip: {
				show: false
			 	},
				data: maxArr
			 }
		]
	};
	useEcharts(myChart, option);
});
</script>
无灰色背景
主要区别在于 去掉了yAxis 数组中的第二个参数 在series字段中增加label 字段
<script setup lang="ts" name="pieChart">
import { ref, onMounted } from "vue";
import * as echarts from "echarts";
import { useEcharts } from "@/hooks/useEcharts";
const echartsRef = ref<HTMLElement>();
onMounted(() => {
	const colorList = ["#EB5757", "#FAA53B", "#4CCCD4", "#274BEF", "#79666", "#79666", "#274BEF", "#274BEF", "#274BEF", "#274BEF"];
	let datas = [
		{
			value: 60,
			name: "金丝猴"
		},
		{
			value: 52,
			name: "斑羚"
		},
		{
			value: 48,
			name: "梅花鹿"
		},
		{
			value: 36,
			name: "红腹锦鸡"
		},
		{
			value: 30,
			name: "猪"
		},
		{
			value: 30,
			name: "测试图片"
		}
	];
	let myChart: echarts.ECharts = echarts.init(echartsRef.value as HTMLElement);
	let option: echarts.EChartsOption = {
		tooltip: {
			show: true
		},
		legend: {
			show: false
		},
		grid: {
			bottom: "0",
			left: "19%"
			// top: "20%",
			// containLabel: true
		},
		xAxis: {
			show: false,
			type: "value"
		},
		yAxis: [
			{
				type: "category",
				inverse: true,
				axisLine: {
					show: false
				},
				axisTick: {
					show: false
				},
				axisPointer: {
					label: {
						show: true,
						margin: 30
					}
				},
				data: datas.map(item => item.name),
				axisLabel: {
					margin: 90,

					align: "left",

					rich: {
						a1: {
							width: 30,
							height: 30,
							align: "center",
							backgroundColor: {
								image: new URL("../../../../assets/images/firstC.png", import.meta.url).href
							}
						},
						a2: {
							backgroundColor: {
								image: new URL("../../../../assets/images/SecondC.png", import.meta.url).href
							},
							width: 30,
							height: 30,
							align: "center"
						},
						a3: {
							backgroundColor: {
								image: new URL("../../../../assets/images/thridC.png", import.meta.url).href
							},
							width: 30,
							height: 30,
							align: "center"
						},
						a4: {
							backgroundColor: {
								image: new URL("../../../../assets/images/blueFour.png", import.meta.url).href
							},
							width: 25,
							height: 25,
							align: "center"
						},
						a5: {
							backgroundColor: {
								image: new URL("../../../../assets/images/blueFive.png", import.meta.url).href
							},
							width: 25,
							height: 25,
							align: "center"
						},
						a6: {
							backgroundColor: {
								image: new URL("../../../../assets/images/blueSix.png", import.meta.url).href
							},
							width: 25,
							height: 25,
							align: "center"
						}
					},

					fontSize: 14,
					formatter: function (params) {
						let index = datas.map(item => item.name).indexOf(params);
						index = index + 1;
						return "{a" + index + "|}" + " " + params;
					}
				}
			}
		],
		series: [
			{
				z: 2,
				name: "数量",
				type: "bar",
				barWidth: 10,
				zlevel: 1,
				label: {
					show: true,
					position: "right",
					color: "inherit"
				},
				data: datas.map((item, i) => {
					return {
						value: item.value,
						itemStyle: {
							color: colorList[i]
						}
					};
				})
			}
		]
	};
	useEcharts(myChart, option);
});
</script>


 2626
2626


 被折叠的 条评论
为什么被折叠?
被折叠的 条评论
为什么被折叠?
 到【灌水乐园】发言


